The Insurance Origins of Height-Weight Tables
A build chart is the table an insurance underwriter uses to compare an applicant's height and weight against reference ranges tied to different rating classes and premium levels — the modern descendant of a tradition that, perhaps surprisingly, insurance companies themselves helped pioneer.
Here's a detail that surprises many people: the height-weight table tradition didn't start in a hospital or a medical school — it started at an insurance company. Beginning in the 1940s, Metropolitan Life Insurance Company published a set of height-weight tables built directly from their own vast policyholder mortality data, correlating body weight at different heights with actual observed life expectancy across millions of real insurance policies. These "Metropolitan Life tables," later revised and republished for decades, became remarkably influential — not just in insurance underwriting, where they originated, but in general clinical medicine as well, shaping how the entire medical profession thought about healthy weight ranges for much of the mid-to-late 20th century.
This is genuinely the same historical lineage our companion educational guide traces through Hamwi, Devine, Robinson, and Miller — all of these mid-20th-century height-weight formulas, whether built by insurers or clinicians, were responding to the same underlying practical need: a fast, standardized way to relate height and weight to health and mortality risk, at a time when detailed body composition measurement simply wasn't available at scale.
It's a genuinely interesting piece of medical and financial history that the direction of influence largely ran from insurance into medicine, rather than the other way around, for much of the 20th century. Life insurance companies had a uniquely large and uniquely motivated dataset: millions of policyholders, decades of tracked outcomes, and a direct financial incentive to understand precisely which biometric factors predicted mortality risk most accurately. Actuaries turned that data into some of the earliest large-scale, statistically grounded height-weight research available anywhere — research that general clinical medicine then adopted and built upon, rather than the reverse. Understanding this history reframes something that might otherwise seem purely commercial: the height-weight tables insurers still use today aren't simply "business rules" layered on top of separate medical science, they're a direct continuation of one of the actual founding datasets of that science.
How Modern Build Charts Actually Work
Today's insurance build charts have moved on considerably from the original Metropolitan Life tables, but the core concept remains recognizable: for a given height, the chart specifies a weight range associated with the most favorable rating class, with progressively less favorable classes as weight moves outside that range in either direction.
| Rating Class | Typical Weight Position | Relative Premium |
|---|---|---|
| Preferred Plus | Comfortably within the chart's favorable range | Lowest (baseline) |
| Preferred / Standard Plus | Near the edges of the favorable range | Modestly above baseline |
| Standard | Moderately outside the favorable range | Meaningfully above baseline |
| Substandard / Table-Rated | Well outside the favorable range | Significantly above baseline, in defined steps |
Unlike the four clinical formulas in our companion educational guide, most modern insurers use their own proprietary build charts, developed from their own claims and mortality data, rather than any single published academic formula. This is a big part of why, as discussed in our companion article on how BMI affects insurance, the exact same height and weight can be rated differently at different insurance companies — each company's chart reflects its own underwriting philosophy and risk appetite, not a single universal standard.
Being Underweight Matters to Underwriters Too
A frequently overlooked point: build charts define a favorable range with both a lower and an upper bound — being significantly underweight for your height can also result in a less favorable rating class, not just being overweight. This mirrors a broader clinical reality: being underweight carries its own distinct health risks, including increased infection risk, osteoporosis, and in some cases an underlying undiagnosed condition, all of which are relevant to an insurer's mortality risk assessment.
This two-sided structure is a useful corrective to a common misconception — that insurance underwriting is simply a matter of "the lower your weight, the better your rate." In reality, most build charts are shaped more like a favorable band or window than a simple downward-sloping scale, with the most favorable rating class sitting somewhere in the middle of the height-appropriate weight range, not at its lowest possible edge.
This point connects directly to the theme running through our companion educational guide: the four classic ideal body weight formulas produce a reference point, not a floor to push below indefinitely. An applicant whose weight sits meaningfully below even the lowest of the four formula estimates for their height is not automatically in a more favorable underwriting position purely by virtue of being lighter — and depending on how far below that reference range they sit, and what's driving it, it can prompt exactly the kind of closer underwriting scrutiny that a comfortably-within-range applicant wouldn't face at all.
Frame Size in Modern Underwriting
As explored in more depth in our companion educational guide, older height-weight tables — including some historical insurance build charts — incorporated a frame-size adjustment, typically small, medium, or large, estimated from wrist or elbow measurements. Some insurers' build charts today still retain a version of this concept, sometimes incorporated indirectly through waist circumference or other measurements discussed in our companion articles on body fat and waist ratios, rather than a formal frame-size questionnaire.
💡 Where Your Calculator Results Fit In
While no insurer will calculate your premium using the exact Devine, Robinson, Miller, or Hamwi formulas from this calculator, understanding how these historical height-weight formulas work gives you genuinely useful intuition for how a modern build chart operates conceptually — both trace back to the same core idea of a reference weight range tied to height, refined over decades of population data.
Where Build Charts Fit in a Paramedical Exam
As covered in more depth in our companion guide on BMI and insurance, life insurance coverage above a given sum-assured threshold typically triggers a paramedical exam recording height, weight, and other biometric data. The build chart comparison is usually the very first data point evaluated in that process, since it requires no lab work and can be assessed immediately, before blood pressure, cholesterol, and blood sugar results are factored into the final overall rating-class decision.
For applicants, this ordering has a practical implication worth understanding: a build chart position that looks unfavorable in isolation is rarely the final word on an application. Just as our companion articles on BMI, body fat, and waist ratio underwriting each emphasize, insurers generally build a complete risk picture from multiple data points collected during the same exam, and a single measurement — however it's framed at first glance — is only ever one input into that broader assessment, not a standalone verdict.
A Worldwide Tour: Which Formula Gets Taught Where
Our companion educational guide covers four historical ideal body weight formulas — Devine, Robinson, Miller, and Hamwi — each developed by a different researcher for clinical dosing purposes. A less obvious but genuinely verifiable regional pattern is which of these formulas actually gets taught and referenced in different countries' clinical and pharmacy training, since that shapes which number a doctor or pharmacist in a given country is most likely to reach for by default.
The United States: Devine as the Default
The Devine formula, developed specifically for American clinical dosing calculations, has become the formula most consistently referenced in US pharmacy and clinical dosing references, including materials used in American pharmacy education and hospital dosing protocols — part of why it has become, by a wide margin, the most internationally recognized of the four formulas despite Robinson and Miller being statistically comparable.
United Kingdom & Europe: A More Mixed Picture
UK and European clinical pharmacology references have historically drawn on a broader mix of the same mid-20th-century height-weight research tradition, sometimes favoring locally adapted body-surface-area or lean-body-weight calculations for specific drug classes rather than defaulting to a single named formula the way American dosing references often do with Devine's.
Why This Matters More Than It Might Seem
Because these formulas were built for medication dosing rather than personal fitness goals — a point our companion guide covers in depth — which one a clinician defaults to can meaningfully affect a calculated drug dose for the same patient, particularly for weight-sensitive medications. This is a genuinely underappreciated example of how a seemingly universal clinical number can carry a specific national or institutional training history behind it, not a single worldwide standard.
Wellness Programs & Weight Tracking
A number of insurers worldwide now incorporate ongoing weight and biometric tracking into wellness programs, offering premium discounts or rewards for maintaining a weight within a favorable range over time, or for sustained improvement toward one — separate from, and generally more flexible than, the one-time build chart assessment made at initial application.
A Historical Perspective Worth Keeping in Mind
One useful piece of context when reviewing any insurer's build chart today: the underlying mortality data these charts are ultimately built from has continued evolving for over eighty years since the original Metropolitan Life tables were first published. Medical advances, changing population health trends, improved treatments for cardiovascular disease, and updated actuarial modeling techniques have all fed back into how modern build charts are constructed — meaning a build chart in active use today, while conceptually descended from that 1940s tradition, reflects contemporary mortality data and contemporary underwriting science, not the original mid-20th-century tables themselves.
This matters practically because it means a build chart genuinely can, and often does, become more favorable over time as population health data and medical treatment options improve — a build chart from a decade ago is not necessarily identical to the version an insurer uses today, even at the same company. This is a reasonable, evidence-based reason to periodically re-shop life insurance coverage over the years, rather than assuming a quote received once will remain the best available option indefinitely as both your own health and the underlying underwriting science continue to evolve.
Practical Steps When Shopping for Coverage
- Ask directly whether an insurer uses a proprietary build chart or a published reference standard, and, where possible, how your specific height and weight combination is likely to be rated.
- Remember the two-sided nature of most build charts — being significantly underweight is not automatically favorable, and extreme weight loss immediately before an exam is not a reliable strategy for a better rating.
- Compare quotes across multiple insurers, ideally through an independent broker, since proprietary build charts genuinely differ between companies.
- Ask about rate reconsideration after sustained change, typically after 6–12 months, verified with an updated exam and updated measurements.
- Consider the full biometric picture together — build chart position, blood pressure, blood sugar, and cholesterol — since insurers generally weigh the combination rather than any single measurement alone.
One last practical thought before the FAQ: none of this history or underwriting detail is meant to suggest that height and weight are the most important factor in whether or how much you pay for coverage. In most modern underwriting frameworks, a build chart position is simply the opening data point in a broader assessment that includes blood pressure, cholesterol, blood sugar, family history, tobacco use, and often lifestyle factors — the same combined-risk-factor approach discussed throughout our companion articles on BMI, body fat, and waist ratio underwriting. Understanding where build charts came from, and how they fit into that bigger picture, is genuinely useful context for reading your own paramedical exam results with realistic expectations, rather than fixating on any single number in isolation.
Frequently Asked Questions
Do insurance build charts use the same formulas as ideal body weight calculators?
Not the exact same formulas, but they share the same historical origin. Most insurers today use their own proprietary tables built from their own claims data rather than any single published clinical formula.
What was the Metropolitan Life height-weight table?
A widely referenced height-weight table published beginning in the 1940s, derived from the insurer's own policyholder mortality data, that shaped both clinical practice and insurance underwriting for decades.
Do insurers still use frame size in underwriting?
Some build charts still include a frame-size-like adjustment, though practices vary significantly between companies and countries.
Is being below ideal body weight also a concern for insurance underwriting?
Yes — being significantly underweight can also result in a less favorable rating class, since build charts typically define a favorable range with both a lower and upper bound.
Can I ask my insurer which build chart or formula they use?
Yes — it's a reasonable question, and most insurers will explain their general underwriting approach if asked directly, even if they don't publish the exact numerical thresholds of their proprietary build chart publicly.
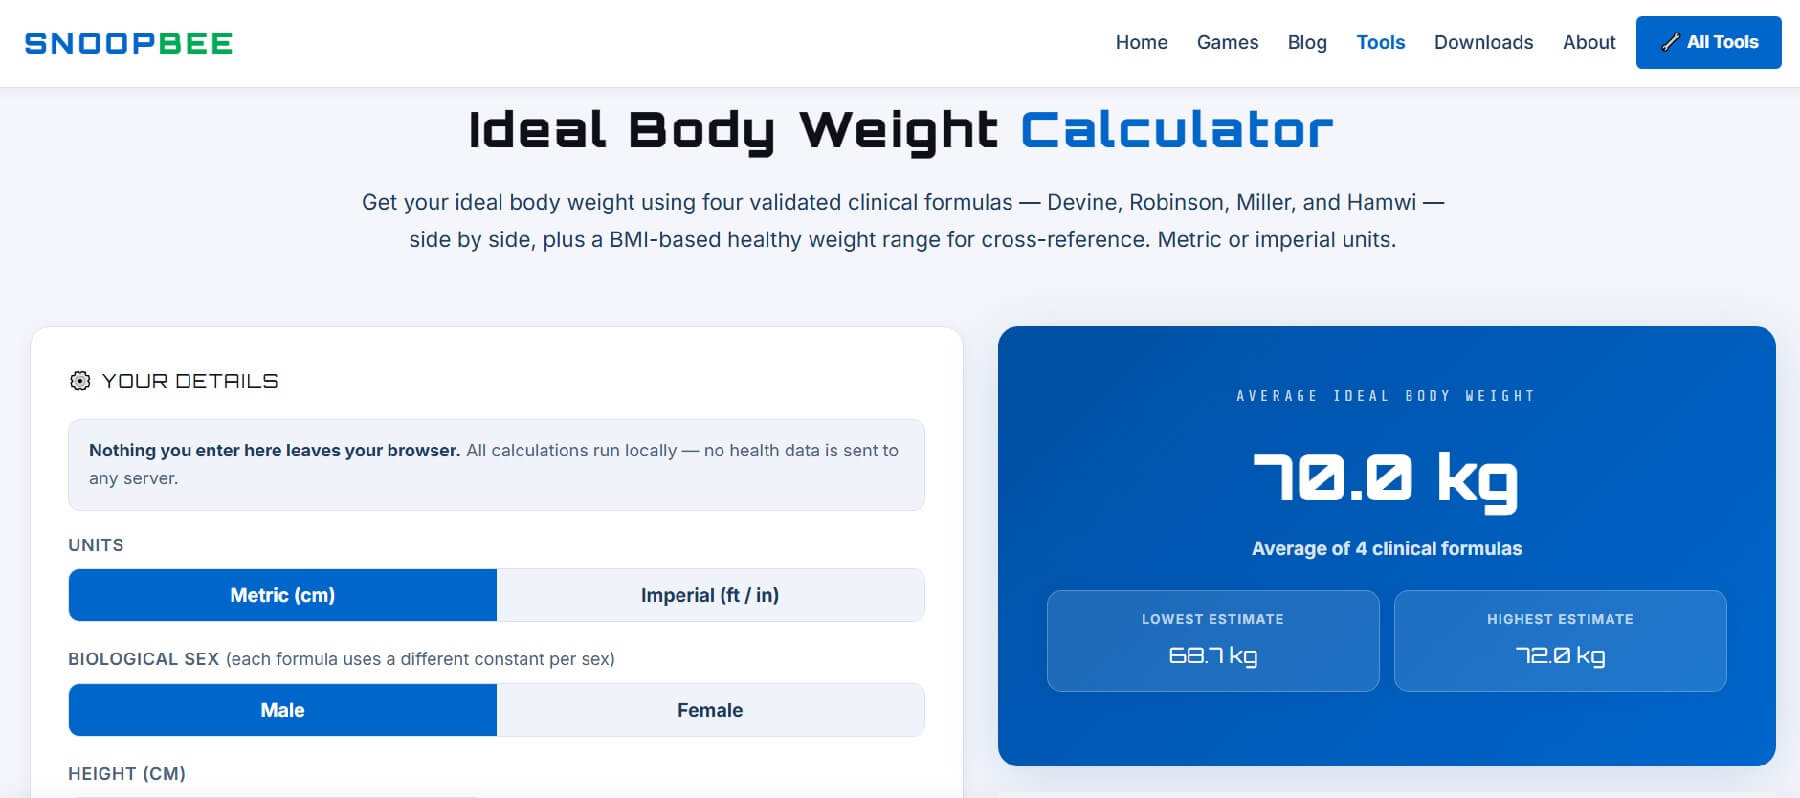
Check Your Ideal Body Weight Before Your Next Policy Review
Open the Ideal Body Weight Calculator →This article is for general educational purposes only and is not financial, legal, insurance, or medical advice. Underwriting practices, rating classes, and product availability vary by insurer, country, and change over time, and the historical figures and formulas discussed here are presented for educational and historical context rather than as a description of any current insurer's specific methodology — always confirm current terms directly with a licensed insurance provider or broker in your jurisdiction. This article does not endorse or recommend any specific insurer or policy. Last updated: August 2026.
💬 Questions & Reader Comments
Ask a question about how ideal body weight or build charts affect insurance in your country, or share your own experience. (Max 200 words)