What Is a Lumpsum Investment?
A lumpsum investment is a single, one-time investment of a fixed amount — as opposed to a SIP, where you invest smaller amounts repeatedly over time. A year-end bonus put into a mutual fund, an inheritance invested in stocks, or a Fixed Deposit maturity amount reinvested elsewhere are all lumpsum investments.
Because a lumpsum investment happens all at once, the entire amount starts compounding from day one — unlike a SIP, where only the first month's contribution has the full time period to grow, while later contributions have progressively less time. This is exactly why lumpsum and SIP math, while related, are calculated using different formulas.
The Future Value Formula, Explained
The future value of a lumpsum investment uses the same core idea as compound interest on a fixed deposit — money grows exponentially, not just by a flat percentage each year, because each year's growth is calculated on the new, larger balance, not the original amount.
- FV — Future Value, what your investment grows to
- PV — Present Value, your initial one-time investment
- r — the annual rate of return (as a decimal, e.g., 12% = 0.12)
- n — the number of years invested
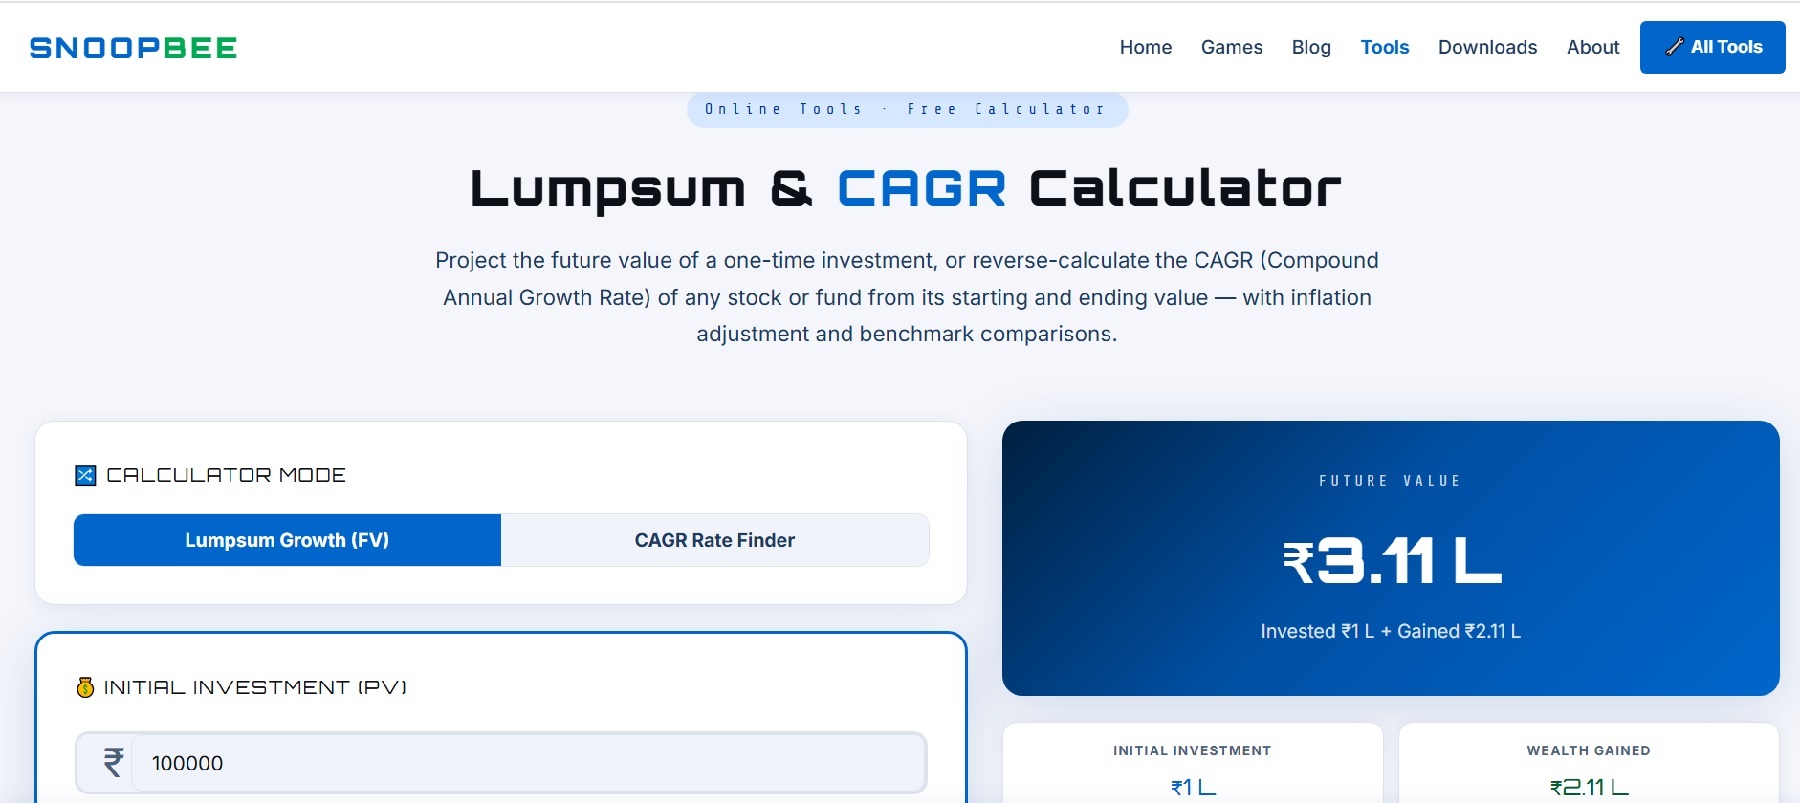
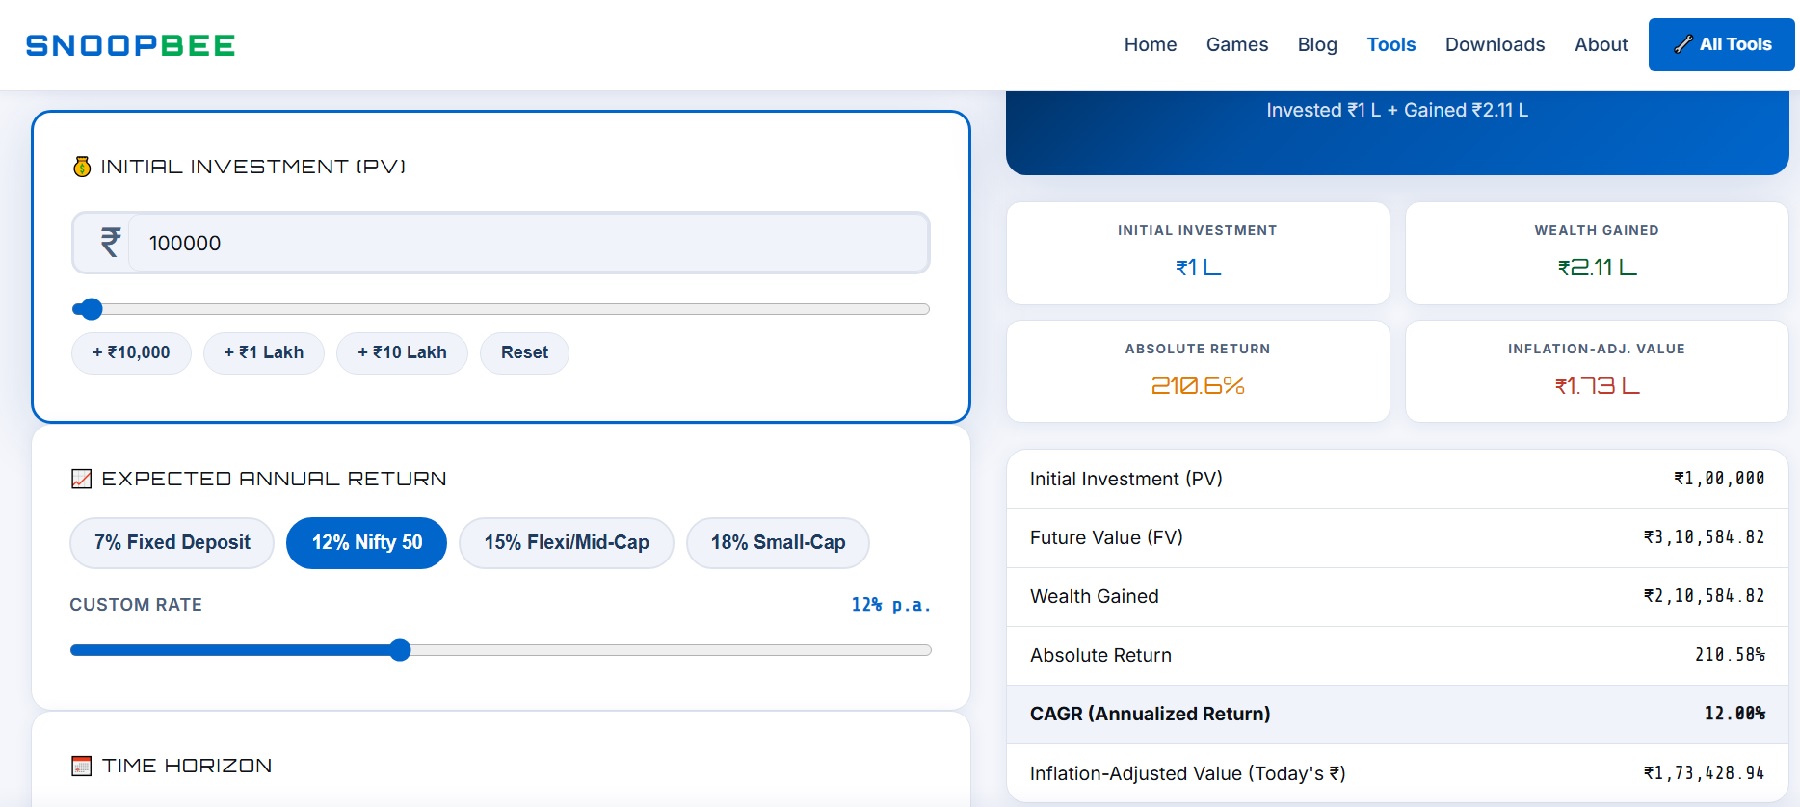
Worked example: ₹1,00,000 invested at 12% expected annual return, for 10 years.
- FV = 1,00,000 × (1.12)10 ≈ ₹3,10,585
- Wealth Gained = 3,10,585 − 1,00,000 = ₹2,10,585
Notice the gain (₹2.1 Lakh) is actually larger than the original investment (₹1 Lakh) — that's the defining feature of long-term compounding: given enough time, the growth eventually outpaces the original principal.
What Is CAGR, and Why Do We Need It?
Imagine you're told a stock "returned 500% over the last 8 years." That sounds impressive, but it's an incomplete picture — was that steady growth, or did it triple in year 1 and stay flat for 7 years? An 8-year 500% return and a 3-year 500% return represent very different investing experiences, even though the headline percentage is identical.
CAGR (Compound Annual Growth Rate) answers a specific question: "What single, steady annual growth rate — compounding every year — would have taken this investment from its starting value to its ending value?" It converts any multi-year return into one number you can directly compare against a bank FD rate, another stock, or a completely different time period.
The CAGR Formula, Explained
Worked example: An investment of ₹1,00,000 grew to ₹2,00,00,000 (₹2 Crore) over 5 years.
- CAGR = (2,00,00,000 ÷ 1,00,000)1/5 − 1 = (200)0.2 − 1 ≈ 188.5% per year
- Absolute Return = ((2,00,00,000 − 1,00,000) ÷ 1,00,000) × 100 = 19,900%
A gut-check for CAGR: if an investment exactly doubles, its CAGR roughly follows the "Rule of 72" — divide 72 by the number of years to double for an approximate annual rate. Doubling in 6 years ≈ 72 ÷ 6 = 12% (the precise CAGR calculation gives 12.25%, very close to this quick estimate).
The Rule of 72 — A Mental Shortcut Worth Knowing
The Rule of 72 is a handy piece of mental math that lets you estimate CAGR (or the time to double) without a calculator in hand. Simply divide 72 by the annual rate, and you get an approximate number of years for an investment to double in value — or run it in reverse, dividing 72 by the number of years to double, to estimate the CAGR.
| Annual Rate | Approx. Years to Double (Rule of 72) | Precise Years to Double |
|---|---|---|
| 6% | 72 ÷ 6 = 12 years | ≈ 11.9 years |
| 9% | 72 ÷ 9 = 8 years | ≈ 8.0 years |
| 12% | 72 ÷ 12 = 6 years | ≈ 6.1 years |
| 18% | 72 ÷ 18 = 4 years | ≈ 4.2 years |
This shortcut is remarkably accurate for rates roughly between 6% and 15%, which conveniently covers most real-world FD, debt fund, and equity index scenarios — making it a genuinely useful tool for quick mental estimates before you sit down with an actual calculator.
CAGR vs Absolute Return — Why the Difference Matters
The 19,900% absolute return and the 188.5% CAGR describe the exact same investment — the difference is entirely about time. Absolute return tells you the total journey; CAGR tells you the annual pace of that journey. Both numbers are "correct," but they answer different questions, and headlines tend to quote whichever number sounds more dramatic.
| Metric | What It Tells You | Best Used For |
|---|---|---|
| Absolute Return | Total % gain over the entire period, regardless of duration | Quick headline of overall performance |
| CAGR | The annualized, compounding growth rate | Fairly comparing investments held for different lengths of time |
Common mistake: Comparing a fund's "3-year absolute return" directly against another fund's "5-year absolute return" is misleading — always convert both to CAGR first, since a longer holding period naturally produces a larger absolute return even at a lower or equal annual pace.
Inflation & Real Purchasing Power
A large future value doesn't automatically mean strong purchasing power, because the cost of goods and services rises over time too.
Worked example: ₹1 Crore, 20 years from now, assuming 6% average annual inflation.
- Real Value = 1,00,00,000 ÷ (1.06)20 ≈ ₹31.2 Lakh in today's purchasing power
This is why any long-term financial goal — retirement, a child's education, buying a home — should be planned using inflation-adjusted, "real" values, not just the impressive-sounding future number.
Comparing Your CAGR to Common Benchmarks
A calculated CAGR only becomes meaningful once you compare it to something familiar. Here are commonly cited illustrative long-term ranges for major Indian asset classes:
These figures are illustrative long-term averages, not guarantees — equity returns in particular vary significantly year to year, and small-cap funds carry meaningfully higher risk alongside their higher potential return. A CAGR above 12% doesn't automatically mean an investment was "better" than a Nifty 50 index fund; it also matters how much extra risk and volatility were taken on to achieve it.
Point-to-Point CAGR vs Rolling Returns
The CAGR you calculate on this page is a point-to-point return — it measures growth between exactly two dates: your start date and your end date. This is simple and useful, but it has a well-known limitation: the exact dates you pick can make an identical fund look wildly different.
Imagine a fund that crashed 20% right after you would have invested, then recovered strongly. A CAGR measured "from the crash" would look spectacular, while a CAGR measured "from just before the crash" would look mediocre — even though it's the same fund over almost the same period. This is exactly why professional analysts often look at rolling returns instead: calculating the CAGR repeatedly using many different overlapping start dates (for example, every month over the past 10 years) and then looking at the average, best-case, and worst-case CAGR across all of them.
Practical takeaway: A single point-to-point CAGR (like the one this calculator produces) is a perfectly valid way to evaluate your own specific investment's actual performance. But when comparing two different mutual funds to decide where to invest going forward, rolling returns (available on most fund fact-sheets and mutual fund research sites) give a much more honest picture of consistency than a single CAGR snapshot.
Lumpsum vs SIP — A Quick Comparison
If you're deciding between investing a windfall as a lumpsum or spreading it monthly via SIP, the honest answer is that neither is universally superior:
- Lumpsum lets your entire amount start compounding immediately, which tends to work out better when markets rise steadily over your holding period.
- SIP spreads your purchases across market highs and lows (rupee cost averaging), reducing the risk of investing your entire amount at a single, possibly unfavourable, price point.
Many investors use a hybrid approach for a large windfall: investing it gradually over a few months via an STP (Systematic Transfer Plan) from a liquid fund into an equity fund, blending lumpsum's full-compounding benefit with SIP's risk-averaging benefit.
Common Mistakes When Reading Investment Returns
Comparing Absolute Returns Across Different Time Periods
As shown above, always convert to CAGR before comparing two investments held for different durations.
Assuming Historical CAGR Will Repeat
A fund's past 5-year CAGR is a historical fact, not a forecast — future returns depend on future market conditions and are never guaranteed.
Ignoring the Risk Behind a High CAGR
A small-cap fund's higher historical CAGR usually comes with higher volatility and a wider range of possible outcomes — a higher number alone doesn't tell you about the bumps along the way.
Forgetting Inflation
A nominal CAGR that beats inflation is a "real" gain; one that doesn't is actually a loss of purchasing power even though the number on paper grew.
Everyday Scenarios
A Student Learning Compound Interest
The FV formula here is the same one taught in school-level compound interest chapters — a real calculator like this one helps make the abstract formula concrete with actual rupee numbers.
An Investor With a Bonus or FD Maturity
Someone deciding where to park a ₹5 Lakh bonus can use Lumpsum mode to compare potential outcomes across an FD (7%), a Nifty 50 index fund (12%), or a more aggressive fund (15–18%), understanding that higher potential return also means higher risk.
Evaluating an Old Stock or Property Purchase
Someone who bought a stock or property years ago and wants to know "was this actually a good investment?" can use CAGR mode — enter the original purchase price, the current value, and the number of years held, to get a fair, annualized answer.
A Retiree Reviewing a Portfolio's Historical Performance
Retirees reviewing decades-old investments (an old mutual fund, PPF, or property) can use CAGR mode to understand the true annualized performance of each holding before making reallocation decisions, ideally alongside a financial advisor.
Comparing Two Mutual Funds Before Investing
An investor deciding between two funds — one that turned ₹1 Lakh into ₹1.8 Lakh over 4 years, and another that turned ₹1 Lakh into ₹2.1 Lakh over 6 years — can't compare these fairly using absolute return alone, since the time periods differ. Converting both to CAGR (roughly 15.8% and 13.2% respectively) makes it immediately clear which fund actually grew money faster per year, independent of how long each was held.
A Quick Word on Taxation
Gains from a lumpsum equity investment held over a year are typically classified as Long-Term Capital Gains (LTCG), taxed differently from gains realised within a year (Short-Term Capital Gains), with debt investments and other asset classes following their own separate rules. Because exemption limits and rates are revised periodically, this guide intentionally avoids quoting specific figures — always check the current rules on the Income Tax Department's website or with a tax professional before making decisions based on tax outcomes.
CAGR Beyond India — A Universal Concept
CAGR is not an Indian-specific concept — it's the standard way analysts and investors worldwide compare multi-year investment performance, whether that's an Indian mutual fund, a Singapore-listed REIT, a Malaysian unit trust, or a US stock. The formula and interpretation remain identical regardless of currency or country; only the typical benchmark rates (local FD rates, local index returns) change from market to market.
Frequently Asked Questions
What is CAGR in simple terms?
CAGR is the single steady annual growth rate that would take an investment from its starting value to its ending value over a given number of years, smoothing out year-to-year ups and downs into one comparable number.
What is the CAGR formula?
CAGR = ((Final Value ÷ Initial Value) raised to the power of 1/years) − 1, expressed as a percentage.
What is the difference between CAGR and absolute return?
Absolute return is the total percentage gain over the entire holding period, while CAGR converts that gain into an annualized rate, making it possible to fairly compare investments held for different lengths of time.
What is the future value formula for a lumpsum investment?
Future Value = Initial Investment × (1 + annual rate of return)^number of years — the standard compound interest formula for a one-time investment.
Why does inflation matter when evaluating investment returns?
Inflation reduces the purchasing power of money over time, so a future value should be divided by (1 + inflation rate)^years to understand what it's actually worth in today's terms.
Try the Numbers Yourself With the Free Calculator
Open the Lumpsum & CAGR Calculator →This article is for general educational purposes only and is not investment advice. Mutual fund and equity investments are subject to market risk; the return rates and figures discussed here are illustrative, based on historical long-term averages, and are not guarantees of future performance. Please consult a SEBI-registered financial advisor before making investment decisions. Last updated: August 2026.
💬 Questions & Reader Comments
Ask a question about lumpsum investing or CAGR, share your own example, or leave feedback. (Max 200 words)