What HbA1c Actually Measures
HbA1c, also called glycated hemoglobin or A1C, measures the percentage of hemoglobin — the oxygen-carrying protein in red blood cells — that has glucose (sugar) attached to it. When glucose circulates in the blood, some of it binds to hemoglobin in a process called glycation, and the higher your average blood sugar has been, the higher the percentage of glycated hemoglobin becomes.
This is fundamentally different from a standard blood glucose test, which captures a single snapshot of blood sugar at the exact moment of the draw. HbA1c instead captures a cumulative signal: once glucose attaches to hemoglobin inside a red blood cell, it stays attached for the remaining lifespan of that cell, which averages around 3 months. That's why a single HbA1c test can stand in for what would otherwise require weeks of repeated glucose measurements to approximate.
Why This Works as a 3-Month Average
Red blood cells live for roughly 120 days on average before being replaced, and at any given moment, a person's bloodstream contains a mix of red blood cells at every stage of that lifespan — some brand new, some nearly at the end of their cycle. This means an HbA1c result isn't a simple average across exactly 90 days; it's weighted toward more recent blood sugar levels, since newer red blood cells (which reflect more recent glucose exposure) make up a larger share of the total pool than the oldest cells nearing replacement.
Research on glycated hemoglobin kinetics generally estimates that the most recent 30 days contribute roughly half of the HbA1c result, the month before that contributes progressively less, and the third month back contributes the smallest share. This weighting has a practical implication worth understanding: a significant, sustained change in blood sugar control over the past month will show up meaningfully in your next HbA1c result, even though the official reference window is often described simply as "the past 2-3 months."
This weighting also explains a pattern that sometimes puzzles people newly starting treatment: a meaningful, sustained improvement in daily blood sugar can take a full testing cycle or more to fully show up in HbA1c, since the result still partially reflects glucose exposure from before the improvement began, embedded in the older red blood cells still circulating. This is one reason doctors generally wait a full three months before reassessing HbA1c after a treatment change, rather than retesting sooner — an earlier test would still be partly measuring the old baseline.
Estimated Average Glucose (eAG) Explained
Estimated Average Glucose (eAG) translates an HbA1c percentage into the same units used on a standard glucose meter — mg/dL in the US, or mmol/L in most other countries — making it easier to compare an HbA1c lab result against the day-to-day numbers a person sees on their own glucose monitor.
This formula wasn't derived theoretically — it comes from the ADAG (A1c-Derived Average Glucose) study, a large research study that had participants wear continuous glucose monitors for extended periods alongside standard HbA1c testing, then statistically modeled the relationship between the two. The resulting linear formula is now the standard method labs and the ADA use to report eAG alongside a raw HbA1c percentage.
Converting eAG in mg/dL to mmol/L, the unit standard in Canada, the UK, most of Europe, Australia, and much of the rest of the world, is a simple division: eAG (mmol/L) = eAG (mg/dL) ÷ 18.
NGSP vs. IFCC: Two Different Units, Same Test
Confusingly, HbA1c results can be reported in two different unit systems depending on where and how the test is processed, and they aren't interchangeable numbers without conversion.
| System | Unit | Where It's Standard |
|---|---|---|
| NGSP | Percentage (%) | United States, UK, and most countries worldwide |
| IFCC | mmol/mol | Some European lab systems and increasingly used internationally alongside NGSP |
The IFCC system, developed by the International Federation of Clinical Chemistry and Laboratory Medicine, measures glycated hemoglobin more directly at the molecular level and was introduced partly to standardize lab results globally, since older percentage-based methods varied somewhat between different lab assay techniques. In practice, most countries still report the familiar NGSP percentage as the primary figure, with IFCC mmol/mol sometimes shown alongside it — which is exactly why a converter that shows both values side by side is useful for comparing results from different labs or countries.
ADA Diabetes Categories
The American Diabetes Association's HbA1c-based categories are one of several diagnostic tools used alongside fasting glucose and oral glucose tolerance testing, and are widely used both for diagnosis and for monitoring existing diabetes management.
| Category | HbA1c | Approx. eAG |
|---|---|---|
| Normal | Below 5.7% | Below ~117 mg/dL (6.5 mmol/L) |
| Prediabetes | 5.7% – 6.4% | ~117–137 mg/dL (6.5–7.6 mmol/L) |
| Diabetes | 6.5% and above | ~140 mg/dL (7.8 mmol/L) and above |
For people already diagnosed with diabetes, treatment targets are typically individualized rather than a single universal number — the ADA's general target for many adults with diabetes is below 7%, though a doctor may set a somewhat higher or lower personalized target depending on age, other health conditions, and hypoglycemia risk.
It's worth noting that these ADA thresholds, while widely used internationally, aren't universally identical to every country's own diagnostic guidelines. The World Health Organization and various national diabetes associations have broadly converged around similar HbA1c cutoffs for diagnosing diabetes at 6.5%, though some bodies define the prediabetes range slightly differently, and a few countries still lean more heavily on fasting glucose or OGTT results as the primary diagnostic tool, using HbA1c as a supporting or monitoring measure rather than the sole diagnostic criterion. If you're comparing a result against published ranges, it's worth confirming which specific guideline your lab or doctor is referencing.
How HbA1c Compares to Other Diabetes Tests
HbA1c is one of several tests used to screen for and diagnose diabetes, and understanding how it differs from the others clarifies why a doctor might order more than one.
| Test | What It Measures | Preparation Needed |
|---|---|---|
| HbA1c | Average blood sugar over ~2-3 months | None — no fasting required |
| Fasting Plasma Glucose (FPG) | Blood sugar at a single moment, after fasting | Fasting 8+ hours beforehand |
| Oral Glucose Tolerance Test (OGTT) | Blood sugar response to a standardized glucose drink over 2 hours | Fasting beforehand, plus 2 hours for the test itself |
| Random Plasma Glucose | Blood sugar at a single moment, any time | None |
HbA1c's biggest practical advantage is convenience — no fasting, no multi-hour test, and no day-to-day variability from a single meal or stressful morning affecting the result. Its main limitation is exactly the flip side of that strength: because it reflects an average, it can't capture dangerous swings, such as an average that looks acceptable overall but that includes concerning episodes of very high or very low blood sugar hidden within that average. This is one reason doctors sometimes use HbA1c alongside direct glucose monitoring rather than as a complete replacement for it, particularly for people already managing diagnosed diabetes.
When HbA1c Can Be Inaccurate
Because HbA1c depends on the behavior of red blood cells specifically, anything that affects red blood cell lifespan or turnover can distort the result independent of actual average blood sugar.
- Anemia and blood loss. Conditions that shorten red blood cell lifespan, or significant recent blood loss, can artificially lower an HbA1c reading regardless of true glucose control.
- Recent blood transfusion. A transfusion introduces donor red blood cells with a different glycation history, which can temporarily skew results.
- Certain hemoglobin variants. Some inherited hemoglobin variants, including some forms more common in people of African, Mediterranean, and Southeast Asian descent, can interfere with certain HbA1c assay methods and produce inaccurate results.
- Chronic kidney disease. Advanced kidney disease can affect red blood cell lifespan and is a recognized source of HbA1c measurement uncertainty.
- Pregnancy. Red blood cell turnover changes during pregnancy, and HbA1c is generally considered less reliable for diagnosing gestational diabetes, where other tests are preferred.
Practical takeaway: if a doctor suspects any of these factors apply, they may rely more heavily on direct glucose testing (fasting glucose, oral glucose tolerance test) rather than HbA1c alone, or interpret an HbA1c result with appropriate caution given the individual's specific situation.
It's also worth understanding a subtler accuracy consideration that's drawn increasing research attention: HbA1c results can genuinely differ somewhat between individuals with identical average glucose levels, due to natural person-to-person variation in red blood cell lifespan and the rate of glycation itself — a phenomenon sometimes referred to as the "glycation gap." This means HbA1c, while an excellent population-level tool and generally reliable for most people, isn't a perfectly precise individual measurement in the way a directly measured glucose value is. For the large majority of people without any of the specific conditions listed above, this effect is small enough not to meaningfully affect clinical decisions, but it's part of why doctors interpret a single HbA1c result in the context of a person's overall history rather than as an isolated, infallible number.
How to Use the HbA1c Converter
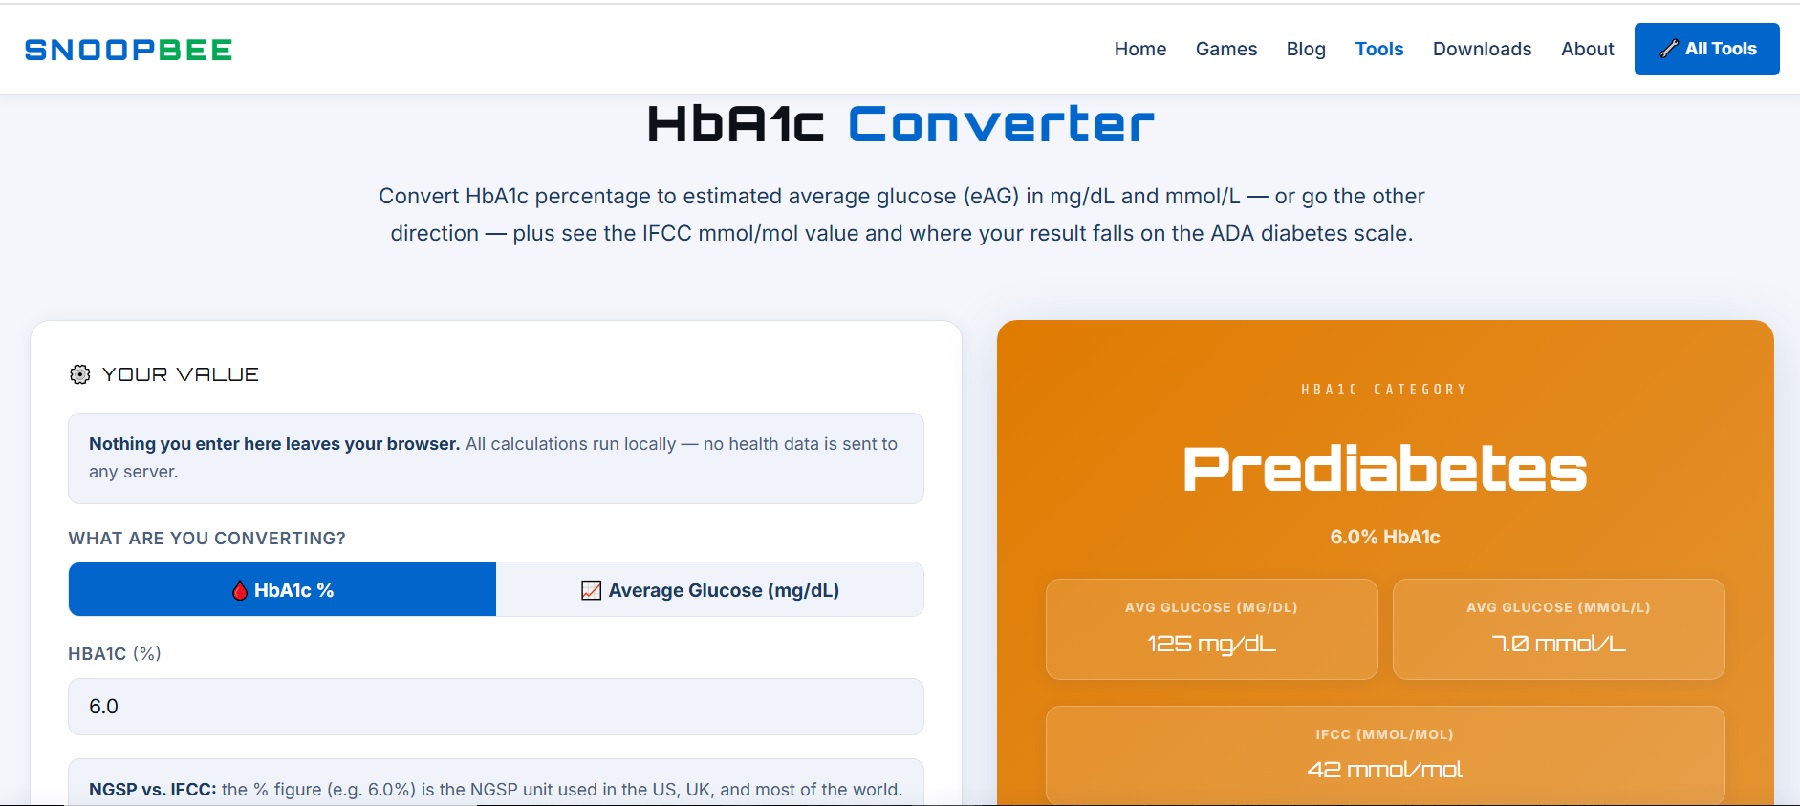
The HbA1c Converter above works in either direction, using the exact ADAG-derived formula explained above.
- Choose your starting value. Select "HbA1c %" if you're starting from a lab result, or "Average Glucose (mg/dL)" if you're starting from a glucose meter or continuous glucose monitor average.
- Enter your number. The calculator instantly computes every other value.
- Read your full result set. You'll see HbA1c %, estimated average glucose in both mg/dL and mmol/L, the IFCC mmol/mol equivalent, and your ADA category, all at once.
Two Full Worked Examples
Example 1: Converting from an HbA1c lab result
A lab result comes back at 6.2% HbA1c (Prediabetes range):
| Metric | Calculation | Result |
|---|---|---|
| eAG (mg/dL) | 28.7 × 6.2 − 46.7 | ~131.3 mg/dL |
| eAG (mmol/L) | 131.3 ÷ 18 | ~7.3 mmol/L |
| IFCC (mmol/mol) | (6.2 − 2.15) × 10.929 | ~44.3 mmol/mol |
This means a 6.2% HbA1c corresponds to blood sugar levels averaging around 131 mg/dL over roughly the past three months — useful context for comparing against day-to-day glucose meter readings, which will naturally swing both above and below that average throughout each day.
Example 2: Converting from a glucose monitor average
A continuous glucose monitor reports an average reading of 154 mg/dL over the past 90 days:
| Metric | Calculation | Result |
|---|---|---|
| HbA1c (%) | (154 + 46.7) ÷ 28.7 | ~7.0% |
| eAG (mmol/L) | 154 ÷ 18 | ~8.6 mmol/L |
| IFCC (mmol/mol) | (7.0 − 2.15) × 10.929 | ~53.0 mmol/mol |
This example shows how someone tracking their glucose monitor data can sanity-check what their next lab-drawn HbA1c is likely to show, or explain to a doctor why a recent average from a CGM lines up (or doesn't) with an official lab result.
HbA1c Across Type 1 and Type 2 Diabetes
While the HbA1c test and its underlying eAG math work identically regardless of diabetes type, the practical role it plays in day-to-day management differs meaningfully between type 1 and type 2 diabetes.
For people with type 1 diabetes, who require insulin to survive and typically monitor glucose multiple times daily or continuously via a CGM, HbA1c generally serves as a longer-term summary metric layered on top of much more granular daily data, useful for spotting overall trends a person might not notice day to day, and for standardized comparison across clinical visits. For people with type 2 diabetes, particularly in earlier stages managed through lifestyle changes or oral medication without frequent glucose testing, HbA1c often serves as the primary ongoing metric a doctor uses to assess control between visits, since day-to-day glucose data may not be routinely collected.
This distinction matters practically: someone with type 1 diabetes and access to detailed CGM data might reasonably weight time-in-range metrics alongside HbA1c fairly evenly, while someone with type 2 diabetes managed primarily through periodic lab visits may find HbA1c remains their single most informative regularly available number — one more reason a simple, accessible converter that clarifies what a given HbA1c actually means in familiar glucose units carries real practical value across both groups.
How Often HbA1c Is Typically Tested
Testing frequency generally depends on diagnosis status and how well-controlled blood sugar currently is. The ADA's general guidance suggests testing at least twice a year for people with diabetes who are meeting treatment goals with stable control, and quarterly (roughly every 3 months) for those whose treatment has recently changed or who aren't meeting their target. For people without a diabetes diagnosis but with risk factors — family history, overweight, or a prior prediabetes result — screening is often recommended every 1 to 3 years, though a doctor's specific recommendation depends on individual risk factors.
Why the 3-month interval makes sense clinically: since HbA1c reflects roughly the past 2-3 months of average blood sugar, testing more frequently than every 3 months for someone with stable, unchanged treatment provides limited additional information, since much of the same red blood cell population is still being measured.
Beyond clinical testing schedules, some people choose to track their own HbA1c trend over time using the results from routine annual physicals or periodic screening, even without a diagnosis — using this converter to translate each new result into eAG lets you compare it apples-to-apples against day-to-day glucose meter or CGM readings, and watching the trend across multiple tests over a year or more can be more informative than fixating on any single result in isolation.
Understanding Glucose Variability Beyond the Average
Two people can have an identical HbA1c of 6.0% while living very different day-to-day glucose realities. One might maintain a fairly steady blood sugar in the 110-140 mg/dL range throughout the day; another might swing widely, spending time both below 70 mg/dL and above 200 mg/dL, with the average simply landing at the same midpoint. This is why continuous glucose monitors, which have become increasingly accessible in recent years, have added a genuinely useful complementary metric alongside HbA1c: "time in range," which tracks the percentage of time blood sugar stays within a target window, capturing variability that a single averaged number cannot.
For most people using this converter simply to translate a lab result into more familiar glucose-meter units, HbA1c and eAG remain a solid, well-validated starting point. But it's worth knowing that for a fuller picture of glucose control — particularly for anyone managing diagnosed diabetes with medication that carries a risk of low blood sugar — HbA1c is best understood as one important data point among several, not the complete story on its own.
What Actually Moves HbA1c Over Time
- Carbohydrate intake and quality. Both total carbohydrate intake and the type consumed (refined vs. fiber-rich, whole-food sources) influence average blood sugar and, over months, HbA1c.
- Physical activity. Regular exercise improves insulin sensitivity, generally supporting lower average blood sugar over time — mechanistically connected to the same cardiovascular fitness benefits our companion heart rate zone guide covers.
- Weight management. Even modest weight loss in people carrying excess weight is associated with measurable HbA1c improvements in research on prediabetes and type 2 diabetes management.
- Sleep quality and consistency. Poor or insufficient sleep, covered in depth in our companion sleep cycle guide, is associated with reduced insulin sensitivity and can meaningfully affect blood sugar control over time.
- Medication adherence. For people prescribed glucose-lowering medication, consistent adherence is one of the most direct and well-supported levers for improving HbA1c over subsequent testing cycles.
- Stress management. Chronic stress elevates cortisol and other hormones that can raise blood sugar, making stress management a genuine, if often underappreciated, factor in longer-term glucose control.
- Hydration. Adequate hydration supports normal kidney function, which plays a role in regulating blood glucose levels, and dehydration can concentrate blood glucose readings somewhat in the short term.
- Meal timing and consistency. Eating at consistent times and avoiding very large, infrequent meals can help moderate blood sugar spikes compared to irregular eating patterns, even when total daily intake is similar.
None of these factors act in isolation — HbA1c improvement over successive tests generally reflects the cumulative effect of several of these working together over months, rather than any single change producing a dramatic shift on its own. This is also why doctors typically encourage a sustainable, multi-factor approach to blood sugar management rather than an intense short-term push before a scheduled test, since HbA1c's 2-3 month averaging window makes it specifically resistant to short-term manipulation in either direction.
Frequently Asked Questions
What is a normal HbA1c level?
Under ADA guidelines, a normal HbA1c is below 5.7%. Prediabetes is 5.7% to 6.4%, and diabetes is diagnosed at 6.5% or above.
How is estimated average glucose (eAG) calculated from HbA1c?
eAG in mg/dL is calculated as 28.7 times the HbA1c percentage minus 46.7, a formula derived from the ADAG study correlating HbA1c with continuous glucose monitoring data.
What is the difference between NGSP and IFCC HbA1c units?
NGSP reports HbA1c as a percentage and is standard in most countries. IFCC reports it in mmol/mol. Both measure the same underlying value, just on different scales.
Can HbA1c be inaccurate in certain people?
Yes. Conditions affecting red blood cell lifespan, including certain anemias, recent blood loss or transfusion, and some hemoglobin variants, can make HbA1c results unreliable.
Does HbA1c reflect blood sugar from the entire past 3 months equally?
No. It's weighted toward more recent blood sugar levels, with roughly the most recent 30 days contributing about half of the result.
Is HbA1c used the same way for type 1 and type 2 diabetes?
The test and formula are identical, but its practical role differs — it often serves as a longer-term summary layered on daily CGM data for type 1 diabetes, and as the primary ongoing metric between visits for many people with type 2 diabetes.
Convert Your HbA1c to Average Glucose Right Now
Open the HbA1c Converter →This article is for general educational purposes only and is not medical advice. It does not diagnose diabetes or prediabetes. HbA1c results can be affected by certain blood conditions, and a single result is not a substitute for clinical evaluation. If you have concerns about your blood sugar or a diabetes diagnosis, consult a doctor. Last updated: August 2026.
💬 Questions & Reader Comments
Ask a question about HbA1c, eAG, or blood sugar tracking, or share your own experience. (Max 200 words)