What Is HICP? The Ruler the ECB Measures Prices With
HICP stands for the Harmonised Index of Consumer Prices — the official yardstick Eurostat and the European Central Bank use to track how prices change across every euro-area country, using an identical method in each one. That word "harmonised" matters: it means a 3% HICP reading in Germany measures exactly the same thing as a 3% HICP reading in Spain, which lets policymakers compare inflation across borders in a way a patchwork of different national indices never could.
Think of HICP as a very large, standardised shopping trolley. Eurostat fills it with a representative basket of everything a typical household spends money on — bread, rent, electricity, a bus pass, a haircut, a streaming subscription — and prices that exact same trolley every single month. If the trolley costs more this month than it did a year ago, that percentage increase is the inflation rate you hear about on the news. If it costs less, that's deflation.
For a younger reader, the simplest way to picture it: imagine your favourite snack cost €1 last year and costs €1.03 this year. That's roughly 3% inflation for that one item. HICP just does this for thousands of items at once, weighted by how much of a typical household's spending actually goes toward each one — rent and food count for a lot more than, say, board games — and rolls it all up into one single number.
Why Does the ECB Target 2% Inflation Instead of 0%?
This is the question almost everyone asks the first time they learn a central bank has an inflation target at all — surely stable prices, at 0%, would be the ideal? The answer is one of the more counter-intuitive ideas in economics, but it holds up: a small, positive rate of inflation is safer for an economy than zero.
The deflation trap: if prices are expected to keep falling, people rationally delay purchases — why buy a washing machine today if it'll be cheaper next year? Multiply that decision across an entire economy and spending slows, businesses sell less, wages come under pressure, and the whole system can spiral into a self-reinforcing slowdown that's extremely hard to escape. Japan spent much of the 1990s and 2000s fighting exactly this problem.
A 2% target does three useful things at once. First, it keeps a healthy buffer above zero, so the odd month of falling prices in one category doesn't tip the whole economy into a deflationary mindset. Second, it gives the central bank room to cut interest rates when the economy needs stimulating — if inflation (and therefore typical interest rates) were already at zero, there'd be much less room to cut before hitting the "zero lower bound." Third, 2% is low enough that most people barely notice it day to day, while still being high enough to grease the wheels of wage and price adjustments that a modern economy relies on.
Headline Inflation vs. Core Inflation
Every month, news reports quote a single inflation number, but economists and the ECB actually watch two related figures side by side.
- Headline inflation is the full HICP reading, including everything — energy, unprocessed food, the works. It's the "real" number that determines how much your total shopping actually costs, but it can swing sharply from one month to the next because of things entirely outside the ECB's control, like a spike in oil prices or a poor harvest.
- Core inflation strips out food and energy to reveal the calmer, more persistent trend underneath. Because it's less noisy, it's usually a better signal of the underlying pressure in the economy, and it's the number central bankers lean on more heavily when deciding whether to raise or cut interest rates.
Worked example: in June 2026, Eurozone headline inflation ran at 2.8% while core inflation sat at 2.4%. That 0.4-point gap tells you a meaningful chunk of the headline number was being driven by short-term swings in energy and food prices rather than a broad-based rise across the whole economy — useful context the single headline figure alone doesn't give you.
2026 Inflation Rates: Eurozone, Germany, France, Italy, Spain & the Baltics
| Region | HICP Rate (June 2026) | Notes |
|---|---|---|
| Eurozone Average | 2.8% | Headline; core sits lower at ~2.4% |
| Germany | 2.4% | Largest Eurozone economy |
| France | 2.0% | Sitting right at the ECB target |
| Italy | 3.1% | Above target |
| Spain | 3.6% | One of the higher Eurozone readings |
| Baltic States (e.g. Lithuania) | 5.4% | Consistently among the highest in the bloc |
| ECB Target (fixed) | 2.0% | Policy benchmark, not a measured rate |
Rates like these are snapshots that move monthly, so treat this table as a starting point — always check the latest release directly from Eurostat or the ECB before relying on any figure for a real financial decision.
The Math: How Purchasing Power Actually Decays
Here's the single most important idea in this whole guide: inflation doesn't erode money in a straight line — it compounds, exactly the way interest does, just working against you instead of for you. A common mistake is to assume 3% inflation for 10 years means "30% gone." It's actually less than that in the early years and accelerates as time goes on, because each year's price rise applies on top of all the previous ones.
Real purchasing power of a fixed sum
Where PV is your starting amount, i is the annual inflation rate as a decimal, and n is the number of years. Worked example: €10,000 sitting idle for 10 years at an average 3.5% inflation rate becomes €10,000 ÷ (1.035)10 = €7,089.19 in today's real purchasing power — a loss of just over 29%, not 35%.
Cumulative percentage loss
Plugging in the same numbers: (1 − 1/(1.035)10) × 100 = 29.11%.
Future cost of a basket of goods
If your weekly shop costs €100 today, in 10 years at the same 3.5% average it becomes €100 × (1.035)10 = €141.06 — the flip side of the same compounding relationship, just multiplying instead of dividing.
Why compounding matters more than people expect: at 3.5% inflation, the first year erodes your money by €350 on €10,000. But the tenth year alone erodes it by roughly €500 — the same percentage rate applied to a purchasing-power base that's already been shrinking. This is exactly why a proper year-by-year calculation (not a flat "rate × years" estimate) matters for anything beyond a couple of years.
The Rule of 72: A Mental-Math Shortcut
If you just want a rough answer without reaching for a calculator, the Rule of 72 gets you remarkably close: divide 72 by the inflation rate (as a whole number, so 3.5 not 0.035) to estimate how many years it takes for money to lose half its real value.
At the ECB's 2% target, that's 72 ÷ 2 = 36 years for money to lose half its value. At the June 2026 Eurozone average of 2.8%, it's 72 ÷ 2.8 ≈ 25.7 years. At the Baltic states' 5.4%, it drops sharply to just 72 ÷ 5.4 ≈ 13.3 years — a vivid illustration of why even a few extra percentage points of inflation compound into a very different long-run outcome. The Rule of 72 is an approximation (the exact formula uses natural logarithms: ln(2) ÷ ln(1 + i)), but it's accurate enough for quick mental comparisons across rates in the low single digits.
Two Ways to Look at the Same Problem
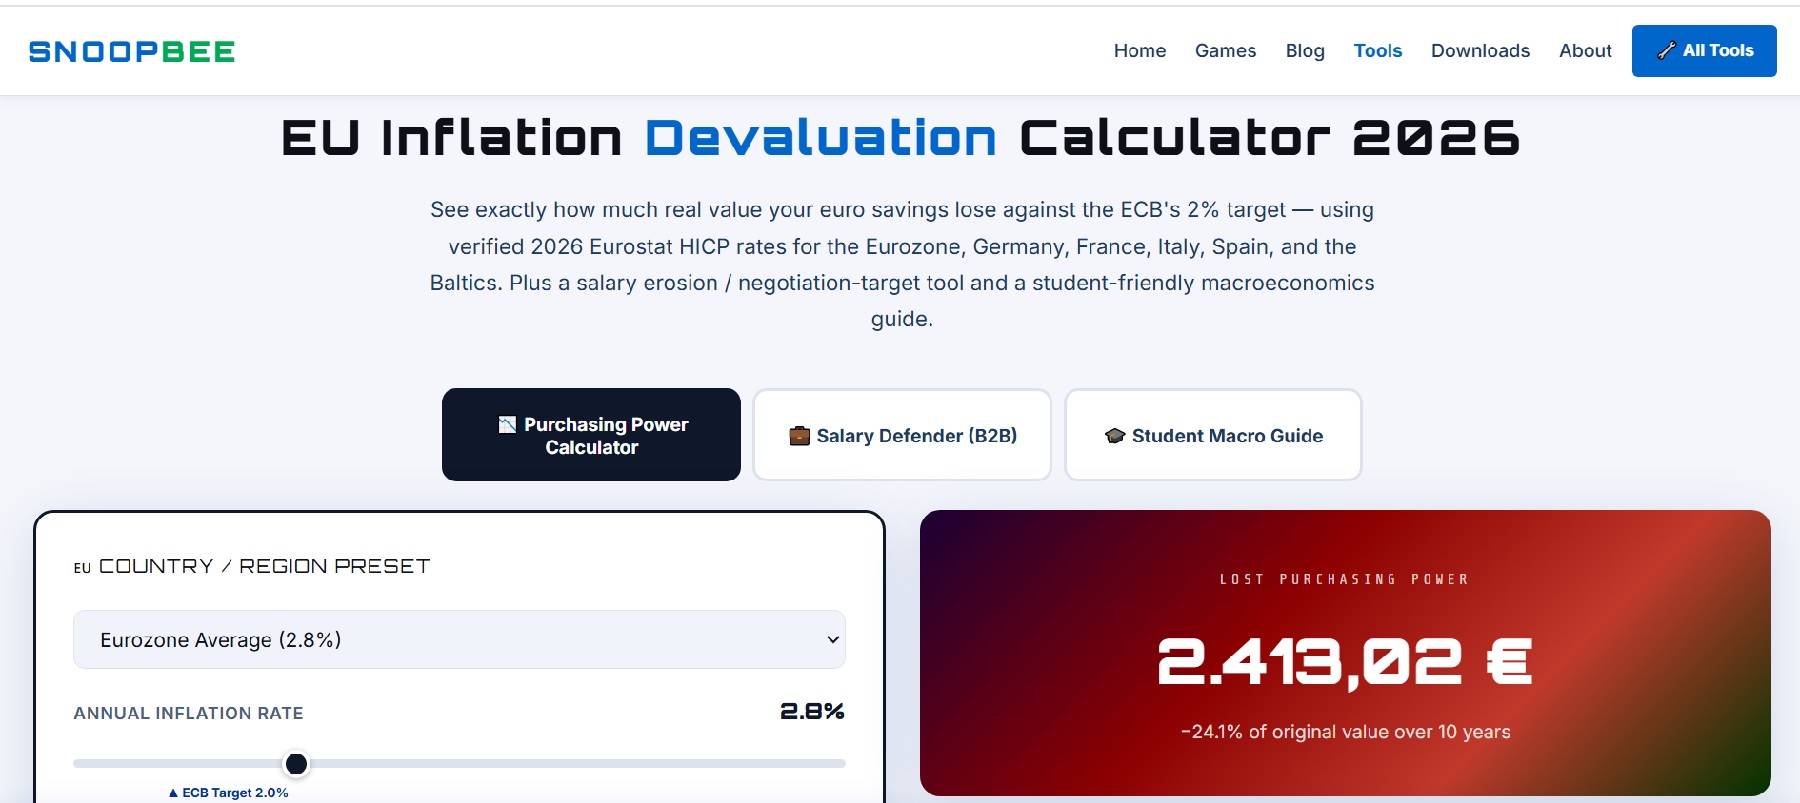
The calculator above offers two views of the exact same underlying math, because different people find different framings more intuitive:
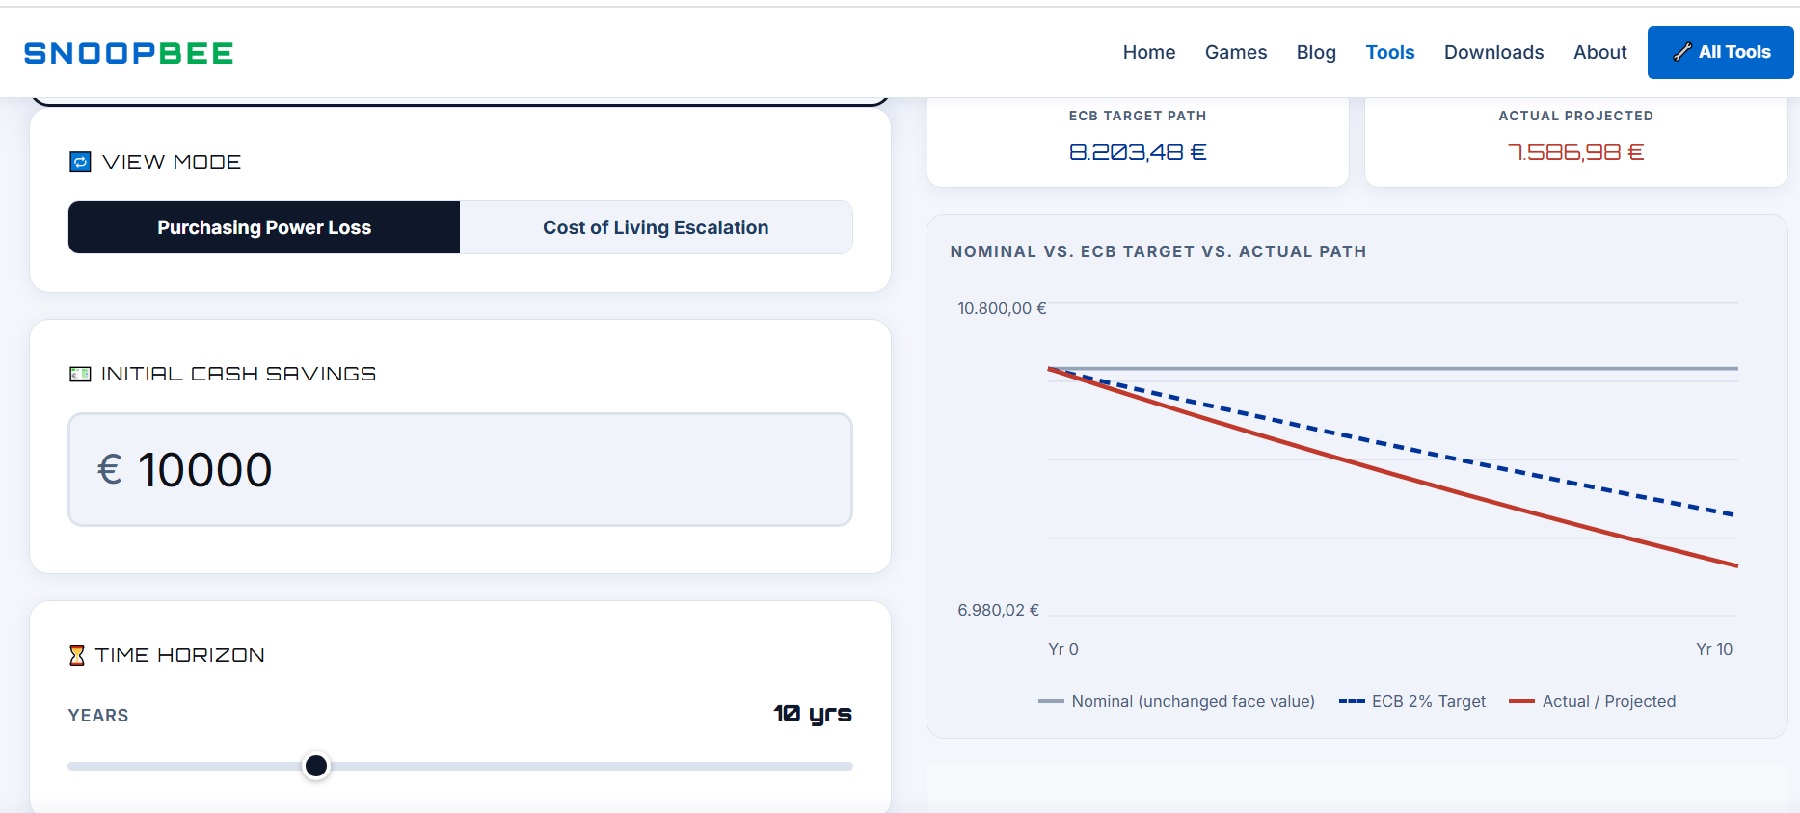
- Purchasing Power Loss starts with a fixed sum of cash — say, savings sitting in a low-interest account — and shows how its real buying power shrinks over time, even though the number printed on the statement never changes.
- Cost of Living Escalation flips the frame: it starts with something you buy regularly and shows how much more it will cost in the future at the same inflation rate, which is often the more visceral, relatable version of the same story.
Both views plot three lines side by side: a flat nominal line (the number on your bank statement, or a good's price today, which never itself changes), a dashed ECB 2% target line showing where things would land if inflation behaved exactly as intended, and a solid actual/projected line using whichever real-world rate you've selected. The gap between the target line and the actual line is, in a very real sense, the cost of inflation running hotter than policymakers intend.
Why Your Salary Erodes the Same Way Cash Does
Here's a connection that surprises a lot of people: a salary that hasn't had a raise erodes in exactly the same mathematical way idle cash savings do. If your pay has stayed flat for three years while inflation has been running at 2.8%, the real purchasing power of that salary today is:
A €60,000 salary that hasn't budged in 3 years at 2.8% average inflation is really only worth about €55,190 in today's terms — you're doing the same job for roughly 8% less real income than you started with, even though the number on your payslip hasn't moved at all.
The flip side is the negotiation target: the nominal salary you'd need today just to break even with where you started, in real terms:
For that same €60,000 salary over 3 years at 2.8%, the break-even target is roughly €65,180 — and that's before accounting for the fact that a raise itself gets taxed. Because part of any pay rise is taken in tax before it reaches your account, restoring your full after-tax purchasing power actually requires asking for a slightly larger gross number than the pure inflation math alone suggests — which is exactly what the tax-adjustment slider in the Salary Defender tab accounts for.
Inflation Through Life: Student, Professional, Retiree
Students
If you're a student, inflation is probably most visible in things you buy often and notice the price of — a coffee, a bus fare, a phone plan. Watching those small, regular prices creep upward over a few years is a genuinely good real-world way to build intuition for compounding, which shows up again and again in personal finance, whether you're talking about inflation, interest rates, or investment returns.
Working Professionals
For anyone earning a salary, understanding that pay flat-lines in real terms even when the number on the payslip never falls is one of the most practically useful pieces of financial literacy there is — it's the difference between accepting a "no raise this year" conversation calmly and understanding exactly what that decision is quietly costing you.
Retirees
If you're living on savings or a fixed pension, inflation is arguably the single biggest long-run risk to your standard of living — a nest egg that looks perfectly adequate today can buy meaningfully less a decade or two into retirement if it isn't invested to at least keep pace with inflation. This is exactly why the "purchasing power loss" framing of this calculator matters most for anyone planning a multi-decade retirement horizon.
Frequently Asked Questions
What is HICP?
The Harmonised Index of Consumer Prices is the official measure Eurostat and the European Central Bank use to track inflation across every euro-area country using an identical methodology, so a percentage change means the same thing regardless of which member state it's measured in.
Why does the ECB target 2% inflation instead of 0%?
A 0% target sits dangerously close to deflation, which is more damaging to an economy than mild inflation because it encourages people to delay spending and can trigger a self-reinforcing economic slowdown. A 2% target gives the central bank a safety buffer and room to cut interest rates when needed.
What's the difference between headline and core inflation?
Headline inflation includes every category in the HICP basket, including volatile energy and unprocessed food prices. Core inflation strips those out to reveal the more stable underlying price trend that policymakers focus on when setting interest rates.
How accurate is the Rule of 72?
It's a close approximation for typical single-digit inflation rates, but it becomes less precise at higher rates. The exact formula uses natural logarithms: ln(2) divided by ln(1 + rate).
Does inflation affect savings and salary the same way?
The underlying math is identical — both divide a fixed euro amount by (1 + inflation rate) raised to the number of years — but a salary that never gets a raise erodes in exactly the same compounding way that idle cash savings do.
Run Your Own Numbers With the Full Calculator
Open the EU Inflation Calculator →This article is for general educational purposes only and is not financial, investment, or tax advice. Inflation rates change monthly and vary by country — confirm current figures with Eurostat or the European Central Bank before making financial decisions. Last updated: July 2026.
💬 Questions & Reader Comments
Ask a question about EU inflation, share how it's affected your savings or salary, or leave feedback. (Max 200 words)