What Are WHR and WHtR, and Why Location Matters
Waist-to-Hip Ratio (WHR) is your waist circumference divided by your hip circumference. Waist-to-Height Ratio (WHtR) is your waist circumference divided by your height. Both are simple ratios, requiring only a flexible tape measure, that reveal how your fat is distributed across your body.
Here's an idea that surprises many people the first time they hear it: two individuals can weigh exactly the same, have the exact same BMI, and even have the exact same body fat percentage — and still carry meaningfully different health risk, simply because of where on their body that fat is stored. Fat carried around the abdomen behaves very differently, biologically, from fat carried around the hips and thighs. WHR and WHtR exist specifically to capture this distinction, which neither BMI nor a single body fat percentage number can see.
This concept has a long history in medicine. French physician Jean Vague first proposed in the 1940s and 1950s that fat distribution pattern, not simply total body fat, predicted metabolic disease risk — a genuinely ahead-of-its-time observation that took several more decades of research to fully validate. Today, both WHR and WHtR are recommended by numerous international health bodies specifically because of the strength of that fat-distribution research.
It's worth appreciating just how much research now backs this once-novel idea. Large international studies spanning tens of thousands of participants across dozens of countries — including the well-known INTERHEART study, which examined heart attack risk factors across 52 countries — have consistently found that waist-based measurements predict cardiovascular events at least as well as BMI, and in several major analyses, meaningfully better. This is a large part of why waist-based measurements have moved from a niche research interest in the mid-20th century to a mainstream, widely recommended clinical tool by the early 21st century.
Visceral Fat vs. Subcutaneous Fat
To understand why fat location matters so much, it helps to understand there are really two very different types of body fat, even though they feel similar to the touch:
- Subcutaneous fat sits directly under the skin — this is the fat you can pinch between your fingers on your arms, thighs, or hips. It's metabolically relatively low-risk in most amounts.
- Visceral fat is stored deeper, wrapped around internal organs inside the abdominal cavity — the liver, pancreas, and intestines. You cannot pinch visceral fat, and you often cannot see how much of it you're carrying just by looking in a mirror.
Why visceral fat is the more dangerous type: visceral fat is metabolically active tissue that releases inflammatory signaling molecules and free fatty acids directly into the bloodstream feeding the liver, which research has linked to insulin resistance, elevated blood pressure, unfavorable cholesterol patterns, and increased cardiovascular disease risk — considerably more strongly than subcutaneous fat carries these same associations.
Because a larger waist circumference relative to hip or height very often reflects a larger amount of visceral fat specifically, WHR and WHtR function as accessible, no-equipment proxies for a type of fat that would otherwise require an expensive CT or MRI scan to measure directly.
There's a helpful mental model for why this matters clinically. Think of visceral fat less like extra padding and more like a small, constantly active hormone-and-signal factory sitting near your liver. The larger this "factory" grows, the more inflammatory signals and free fatty acids it releases directly into a blood supply that feeds straight into the liver — the organ most responsible for regulating blood sugar and cholesterol throughout the body. Over years, this steady chemical signaling is a major part of the biological pathway linking abdominal fat specifically to insulin resistance, unfavorable cholesterol changes, and elevated blood pressure — which is precisely why the location of fat storage, not simply the total amount, carries such distinct clinical significance.
Waist-to-Hip Ratio, Explained Term by Term
Both measurements are taken in the same unit (centimeters or inches — it cancels out either way, since WHR is a pure ratio with no unit of its own). Because it's a ratio, a WHR of 0.85 means your waist measures 85% of your hip circumference, regardless of whether you're measuring in inches or centimeters.
| Category | Men (WHR) | Women (WHR) |
|---|---|---|
| Low Risk | Below 0.90 | Below 0.80 |
| Moderate Risk | 0.90 – 0.99 | 0.80 – 0.85 |
| High Risk | 1.00 and above | Above 0.85 |
Worked example: a person with an 85 cm waist and a 100 cm hip measurement has a WHR of 85 ÷ 100 = 0.85. For a man, that falls in the "Low Risk" category; for a woman, that same 0.85 falls in the "Moderate Risk" category — once again illustrating why sex-specific thresholds matter throughout body composition science.
It's worth walking through why the math works out this way, since the underlying logic applies to every ratio-based measurement in this guide. A WHR is, at its core, simply describing shape rather than size — two people of very different overall builds can share the identical WHR if their waist and hip measurements scale together proportionally. This is precisely the point: WHR isn't trying to tell you how big someone is overall, a job BMI and bodyweight already do reasonably well. It's specifically trying to tell you the shape of that size — where, proportionally, the mass sits.
Notice that women's thresholds are meaningfully lower than men's at every category level — this reflects normal biological differences in pelvic structure and typical fat storage patterns between the sexes, not a stricter standard being applied to women.
Apple vs. Pear: Body Shape & Fat Distribution
You've likely heard bodies informally described as "apple-shaped" or "pear-shaped" — these everyday terms actually map directly onto the WHR concept, and understanding them helps make the underlying science more intuitive.
- Apple-shaped (higher WHR): fat concentrated around the abdomen and upper body, producing a rounder midsection relative to the hips. This pattern is sometimes called "android" fat distribution in clinical literature, and research consistently associates it with higher cardiometabolic risk at a given bodyweight.
- Pear-shaped (lower WHR): fat concentrated around the hips and thighs, producing a narrower waist relative to the hips. Sometimes called "gynoid" distribution, this pattern is associated with comparatively lower cardiometabolic risk, though it is not risk-free at extreme levels.
Why this pattern differs by sex on average: estrogen tends to promote fat storage around the hips and thighs, which is part of why a "pear" pattern is statistically more common in premenopausal women, while testosterone tends to promote abdominal fat storage, more common in men. After menopause, many women's fat distribution pattern shifts to become more "apple-like" on average, which is one reason cardiovascular risk assessment often becomes more waist-circumference-focused for women in this life stage.
It's worth being clear that "apple" and "pear" are informal, everyday descriptions rather than precise clinical categories — real bodies exist on a continuous spectrum between these two patterns rather than falling neatly into one box or the other, and genetics play a substantial role in determining where any individual naturally sits along that spectrum, independent of lifestyle factors. Two people can follow an identical diet and exercise routine and still develop somewhat different waist-to-hip proportions over time, simply due to inherited differences in where their bodies preferentially store excess energy. This is exactly why WHR is best understood as a risk indicator to be aware of and monitor, rather than a personal failing to feel discouraged about — genetics set a meaningful part of the starting point, even though lifestyle factors like diet, physical activity, sleep, and stress management still meaningfully influence the number over time within that genetic range.
Waist-to-Height Ratio, Explained Term by Term
WHtR takes a different comparison point than WHR — instead of comparing waist to hip, it compares waist directly to height. Because taller and shorter people naturally have different "normal" waist sizes, dividing by height creates a single ratio that works sensibly across the full range of human heights, without needing a lookup table.
| WHtR Range | Category |
|---|---|
| Below 0.40 | Underweight Range (for most adults) |
| 0.40 – 0.49 | Healthy Range |
| 0.50 – 0.59 | Increased Risk (Central Obesity Range) |
| 0.60 and above | High Risk |
Worked example: a person who is 175 cm tall with an 85 cm waist has a WHtR of 85 ÷ 175 = 0.49, just inside the healthy range. The same 85 cm waist on someone who is 160 cm tall gives a WHtR of 85 ÷ 160 = 0.53, landing in the increased-risk range — illustrating exactly why height matters and why a single universal waist circumference number (unadjusted for height) is less informative than WHtR.
The widely cited public health message built from this research — "keep your waist circumference to less than half your height" — comes directly from the WHtR = 0.50 threshold, and has been promoted specifically because it's remarkably easy to remember and self-check without needing a category chart at all.
Population & Ethnicity-Specific Waist Thresholds
One of the most practically important refinements to waist-based risk assessment — and one that's particularly relevant to a global audience — is that health authorities in several countries have adopted lower waist circumference action points than the general Western reference values, based on population-level research showing elevated cardiometabolic risk at smaller waist measurements in these groups.
| Population Reference Group | Men — Increased Risk Threshold | Women — Increased Risk Threshold |
|---|---|---|
| Europid (general Western/WHO reference) | 94 cm (37 in) | 80 cm (31.5 in) |
| South Asian (incl. India, Bangladesh, Pakistan, Sri Lanka) | 90 cm (35.4 in) | 80 cm (31.5 in) |
| Chinese | 90 cm (35.4 in) | 80 cm (31.5 in) |
| Japanese | 90 cm (35.4 in) | 80 cm (31.5 in) (some Japanese national guidelines cite 90 cm) |
These lower thresholds for South Asian, Chinese, and Japanese populations are grounded in research showing that, at a matched waist circumference, individuals from these population groups on average carry a higher amount of visceral fat and face elevated cardiometabolic risk compared to individuals of European descent — a pattern that echoes the same population-specific research discussed for BMI thresholds in our companion BMI, BMR & TDEE guide. The International Diabetes Federation and World Health Organization have both incorporated these population-specific reference points into their metabolic syndrome and cardiovascular risk screening guidance.
Why this matters for readers across Asia: if you live in, or your doctor practices under health guidelines common to, India, China, Japan, or much of the rest of South and East Asia, a waist measurement that would be considered "borderline" or entirely acceptable under general Western reference values may already represent an actionable risk signal under your region's own clinical guidance. This calculator reports the general reference categories described above; if a doctor has given you a population-specific target, that guidance should take precedence.
How to Take Accurate Measurements
The same three measurements feed both WHR and WHtR, so getting them right once pays off across both results.
- Waist: measure at the narrowest point of the torso, usually just above the navel — or, if using the World Health Organization's protocol, at the midpoint between the lowest rib and the top of the hip bone.
- Hip: measure at the widest point around the buttocks, keeping the tape horizontal and parallel to the floor.
- Height: measure without shoes, standing straight against a flat wall.
Consistency tip: measure in the morning, before eating, with the tape snug but not compressing the skin, and take each measurement twice to average out small errors. Because both ratios use the same waist measurement, getting that single number right accurately is the highest-leverage thing you can do for the accuracy of both results.
WHR vs. WHtR vs. BMI: Which Should You Use?
| Metric | What It Captures | Limitation |
|---|---|---|
| BMI | Overall weight relative to height | Cannot distinguish fat from muscle, or fat location |
| WHR | Fat distribution pattern (apple vs. pear) | Requires sex-specific interpretation; less intuitive as a single number |
| WHtR | Central/abdominal fat relative to body frame size | Doesn't separately capture hip-based fat distribution pattern |
The evidence-based answer: use them together. A growing body of research suggests that combining BMI with a waist-based measurement — either WHR or WHtR — gives a meaningfully more complete risk picture than any single measurement alone, since each one captures information the others miss. This is exactly the logic behind pairing this calculator with our companion BMI, BMR & TDEE Calculator rather than treating either tool as a complete standalone assessment.
Limitations Worth Knowing
Like every field-measurement tool covered on this site, WHR and WHtR are screening aids, not diagnostic instruments, and they carry real limitations worth understanding:
- Pregnancy makes both ratios meaningless for their intended purpose, since abdominal expansion during pregnancy is expected and healthy rather than a risk signal.
- Very tall or very short individuals can occasionally see WHtR behave slightly less predictably at the extremes of the height distribution, though this is a smaller effect than the height-distortion BMI experiences.
- Bloating, recent meals, or the timing of a woman's menstrual cycle can shift waist measurement by a centimeter or more day-to-day, which is exactly why tracking a trend over several consistent measurements is more meaningful than reacting to any single reading.
- Neither ratio replaces a direct visceral fat measurement (such as a CT or MRI scan) — they are well-validated proxies, not the actual measurement of internal fat itself, and a doctor may recommend direct imaging in specific clinical situations where more precision is needed.
None of these limitations undermine the practical value of WHR and WHtR for everyday tracking — they simply mean the same principle that applies to every measurement method covered across this site's health calculators also applies here: a single reading is a snapshot, and a consistent trend measured the same way over weeks and months tells a far more reliable story than any one data point in isolation.
A Life-Stage Guide: Students, Professionals & Retirees
Students & Young Adults
Body shape continues developing through adolescence, and hip and waist proportions shift naturally with puberty — a student using this calculator should treat it as an educational tool for understanding the underlying science rather than a personal target, particularly before full physical development is complete.
Working Professionals
This age range is where WHR and WHtR research has been most extensively validated. A useful habit is tracking waist circumference alongside — not instead of — bodyweight or BMI, since waist size can change meaningfully even when total weight stays relatively stable, particularly with changes in exercise habits or stress-related abdominal fat accumulation. Chronic psychological stress deserves a specific mention here: sustained elevated cortisol, the body's primary stress hormone, has been linked in research to a tendency toward increased abdominal fat storage specifically, somewhat independent of overall calorie balance — which is one reason career-stage stress management is sometimes discussed as relevant to waist-focused health metrics, not purely diet and exercise habits alone.
Retirees & Older Adults
As discussed above, fat distribution patterns often shift toward more abdominal (apple-shaped) storage with age, particularly after menopause in women, even without significant total weight change — making WHR and WHtR especially informative additions to health tracking in this age group, since they can reveal a meaningful shift in risk that bodyweight alone would completely miss.
There's also a practical measurement consideration specific to older adults: natural changes in posture and spinal curvature that can occur with age sometimes make a traditional standing waist measurement slightly less consistent over time than it was in younger adulthood. Measuring seated, or being especially deliberate about standing tall and relaxed for each measurement, can help keep results comparable from one check-in to the next.
How to Use the Waist Ratio Calculator
- Open the Waist-to-Hip & Waist-to-Height Ratio Calculator and choose your unit system — metric (cm) or imperial (in).
- Select your biological sex, which determines the WHR risk category thresholds used.
- Enter your height, waist, and hip measurements, taken as described above.
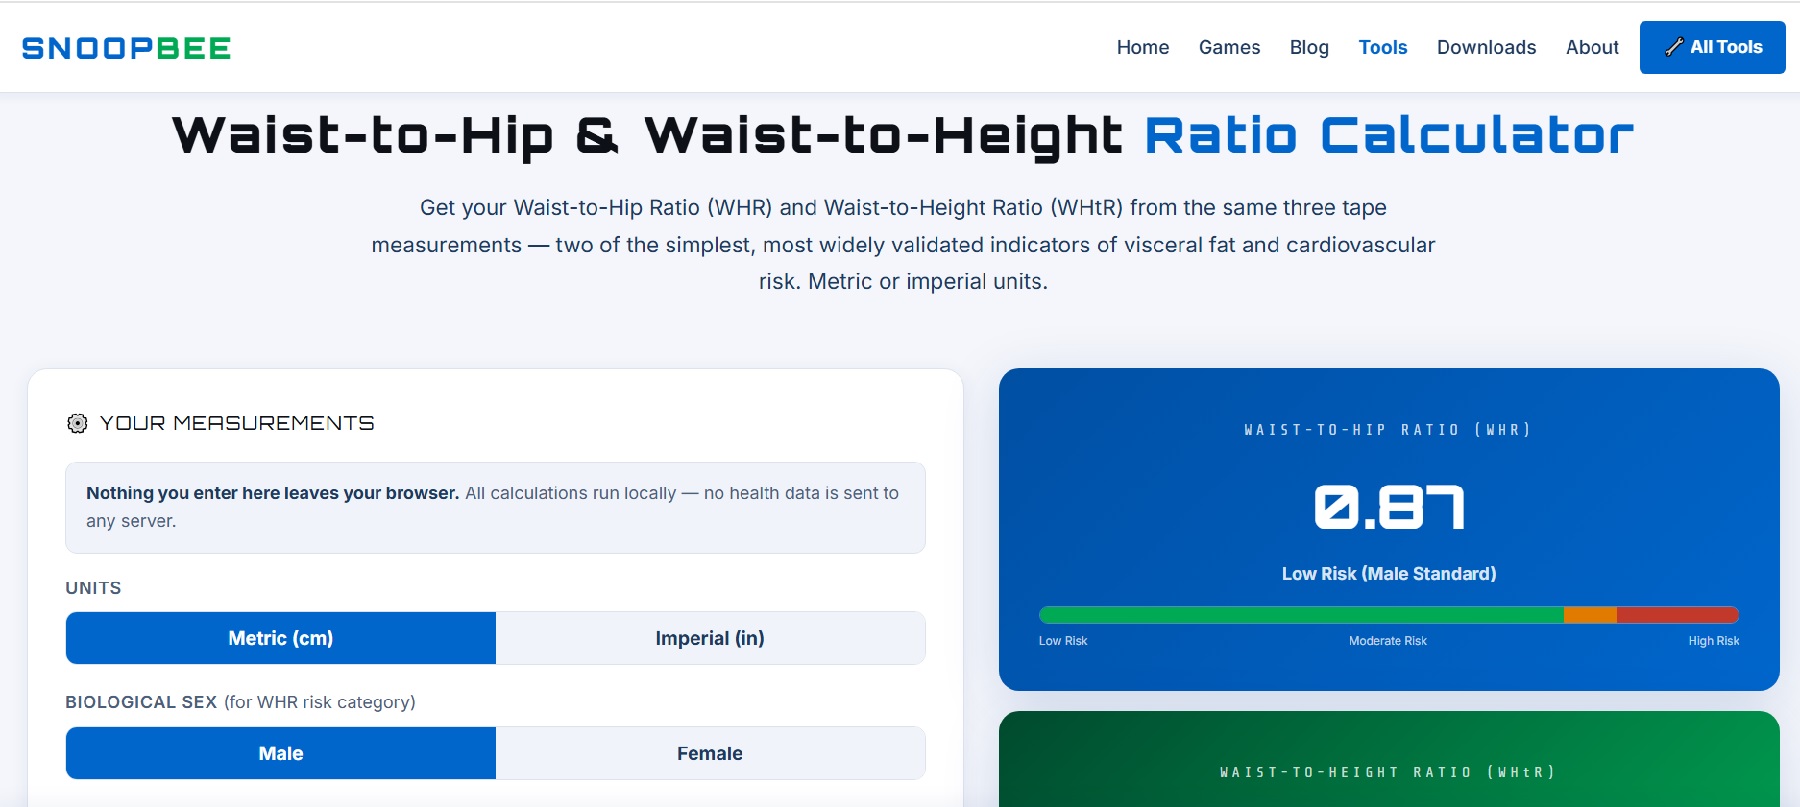
- Read your results instantly: WHR and WHtR values, their risk categories, and the simple "waist under half your height" check all update as you type.
- Use the Export buttons to download a PDF or Excel summary for tracking over time or sharing with a doctor.
Terminology Key
| Term | Meaning |
|---|---|
| WHR | Waist-to-Hip Ratio — waist circumference divided by hip circumference |
| WHtR | Waist-to-Height Ratio — waist circumference divided by height |
| Visceral Fat | Fat stored around internal organs inside the abdominal cavity |
| Subcutaneous Fat | Fat stored directly under the skin |
| Android Distribution | Fat storage concentrated around the abdomen (the "apple" pattern) |
| Gynoid Distribution | Fat storage concentrated around the hips and thighs (the "pear" pattern) |
| Central Obesity | Excess fat specifically stored around the abdomen |
Frequently Asked Questions
What is a healthy waist-to-hip ratio?
A WHR below 0.90 is generally considered low risk for men, and below 0.80 for women. Higher ratios are associated with increased cardiovascular and metabolic risk.
What is a healthy waist-to-height ratio?
A WHtR below 0.50 — meaning your waist is less than half your height — is a widely cited, simple healthy target for most adults, regardless of sex.
Why is WHtR sometimes considered better than BMI?
WHtR directly reflects central fat, which research links more strongly to cardiometabolic risk than total bodyweight or BMI, and applies a single simple threshold across different heights.
What are apple-shaped and pear-shaped bodies?
Informal terms for fat distribution: "apple-shaped" means fat concentrated around the abdomen (higher WHR), and "pear-shaped" means fat concentrated around the hips and thighs (lower WHR).
Can WHR and WHtR be used together with BMI?
Yes — using BMI alongside a waist-based measurement gives a more complete picture than either alone, since they capture different aspects of body composition.
Check Your Own WHR & WHtR Now
Open the Waist Ratio Calculator →This article is for general educational purposes only and is not medical advice. Tape-measurement accuracy can vary with technique and individual body shape, and these ratios are not a substitute for a clinical assessment. Always consult a doctor or qualified professional before making significant changes to your diet or exercise routine. Last updated: August 2026.
💬 Questions & Reader Comments
Ask a question about WHR, WHtR, or body fat distribution, or share your own experience. (Max 200 words)