Why Heart Rate Is the Simplest Intensity Measurement You Own
Heart rate training uses your pulse — beats per minute (bpm) — as a real-time measure of exercise intensity, allowing you to train at a specific, targeted effort level rather than guessing based on how hard something "feels."
Here's the core idea in plain terms: your heart beats faster the harder your muscles are working, in a fairly predictable, measurable relationship. This makes heart rate one of the most practical intensity gauges available to anyone — no laboratory equipment required, just a pulse you can feel at your wrist or neck, or a chest strap or wrist-based sensor for continuous tracking during exercise.
The entire discipline of "heart rate zone training" is built on a simple, well-supported principle from exercise physiology: different intensity levels produce measurably different physiological adaptations. Very light effort improves recovery and basic circulation. Moderate effort builds aerobic endurance. High effort improves your body's ability to clear lactate and sustain intense output. Training exclusively at one intensity, or without any structure at all, is a well-documented way to plateau — which is precisely the problem heart rate zones are designed to solve.
It's worth understanding briefly why heart rate correlates so reliably with exercise intensity in the first place, since this relationship is the entire physiological foundation this calculator rests on. Working muscles demand more oxygen and fuel as effort increases, and the cardiovascular system's primary lever for delivering more oxygenated blood, on short notice, is increasing how often the heart beats — cardiac output (total blood pumped per minute) rises through a combination of a faster heart rate and, to a lesser extent in most people, a larger volume of blood pumped per beat. Across a wide range of submaximal effort, this relationship between heart rate and oxygen consumption is close to linear, which is exactly why heart rate functions as such a reliable, practical real-time proxy for exercise intensity without needing a laboratory gas-exchange analyzer strapped to your face.
Estimating Maximum Heart Rate: 220 Minus Age & Its Limits
This formula has been the default heart rate calculation taught in gyms, fitness magazines, and exercise science textbooks for decades. Its actual origin is surprisingly informal: it's widely traced back to a brief 1970 research summary, not a large, rigorously controlled study specifically designed to validate it — a detail that surprises many people once they learn it, given how universally the formula has been repeated ever since.
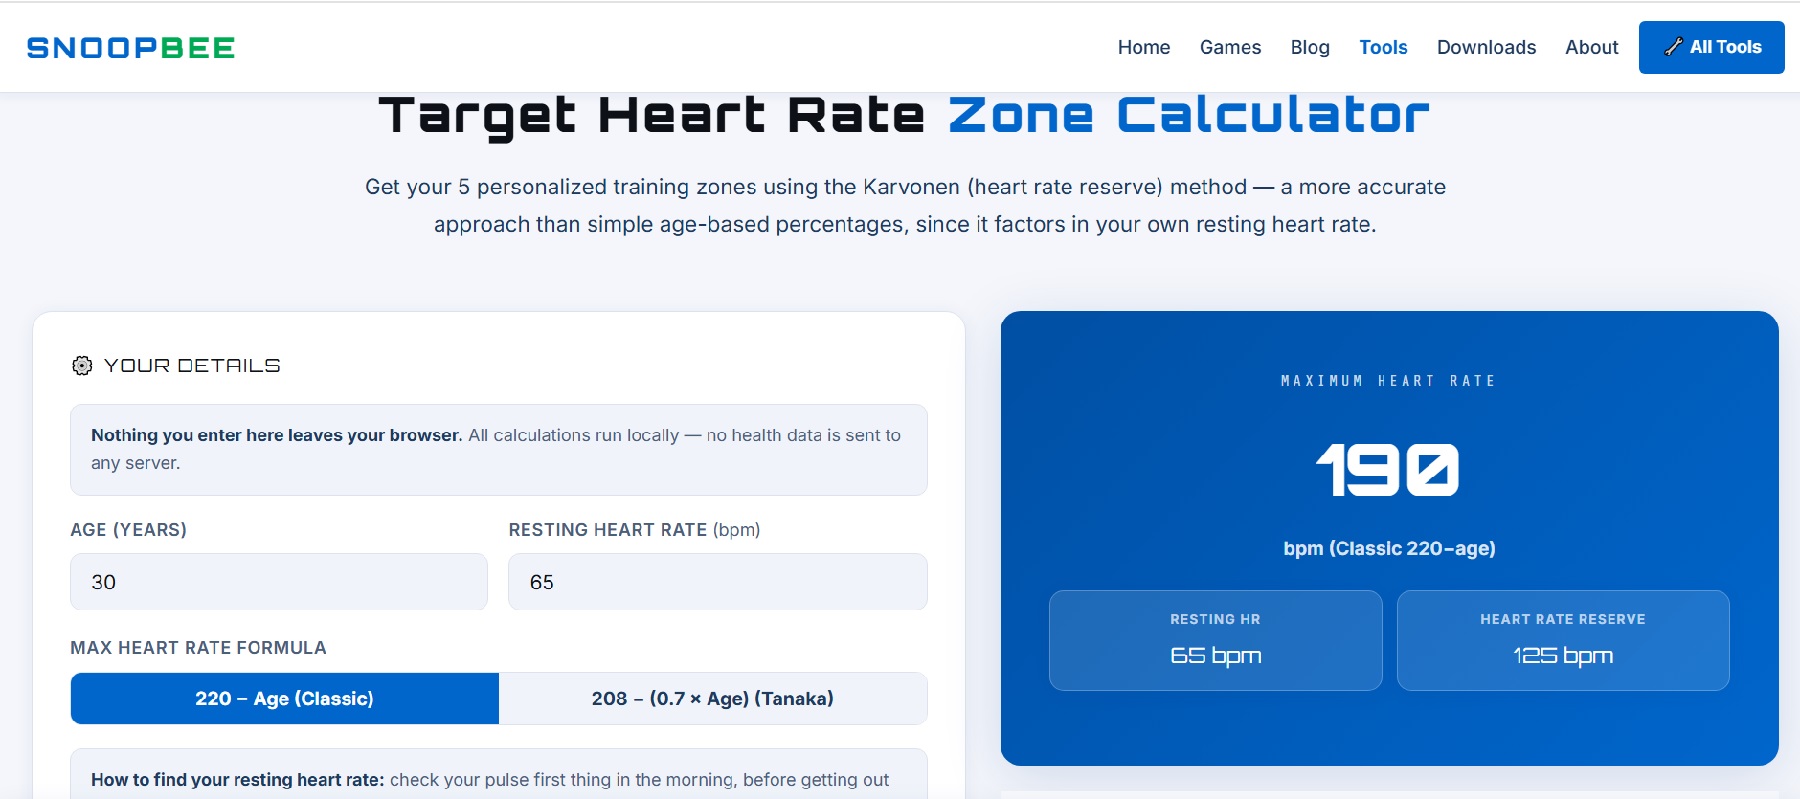
Worked example: a 30-year-old has an estimated max HR of 220 − 30 = 190 bpm, the figure used in the worked examples throughout the rest of this guide.
The real limitation: research examining this formula against actual measured maximum heart rates has found a standard error of roughly ±10 to 12 beats per minute — meaning a formula-predicted max HR of 190 could, for a meaningful share of individuals, actually represent a true max HR anywhere from roughly 178 to 202 bpm in practice. For training zone purposes this is usually an acceptable approximation, but it's genuinely important to understand it as an estimate, not a precise personal measurement.
The Tanaka Formula: A More Modern Alternative
Published in 2001 by researcher Hirofumi Tanaka and colleagues, this formula was derived from a meta-analysis pooling data across a much larger, more diverse set of studies than the informal foundation behind the older 220-minus-age rule. It's generally considered a somewhat more accurate estimate across a broader adult age range, and this calculator offers it as a selectable alternative.
Worked example: that same 30-year-old has a Tanaka-formula max HR of 208 − (0.7 × 30) = 208 − 21 = 187 bpm — close to, but meaningfully different from, the 190 bpm the classic formula produces. The two formulas diverge further at older ages, since Tanaka's per-year decline rate (0.7 bpm/year) is gentler than the classic formula's implicit 1 bpm/year decline.
Which should you use? Neither formula is definitively "correct" for any given individual — both are population averages. The Tanaka formula has somewhat stronger research support behind its derivation, but the classic 220-minus-age formula remains extremely widely used and referenced. This calculator lets you toggle between both so you can compare, or use whichever your coach, doctor, or fitness tracker already references for consistency.
Resting Heart Rate: Your Personal Fitness Baseline
Resting heart rate is your pulse when you are completely at rest — the clearest, simplest everyday indicator of baseline cardiovascular fitness, since a more efficient, better-conditioned heart pumps more blood per beat and therefore doesn't need to beat as often to meet the body's resting needs.
Typical adult resting heart rate ranges from about 60 to 100 bpm, though well-trained endurance athletes often measure considerably lower — sometimes into the 40s — as a direct physiological result of a larger, more efficient heart developed through sustained aerobic training. This is precisely why the Karvonen method, covered next, uses resting heart rate as a core input: it captures a genuine, individual fitness signal that a formula based on age alone simply cannot see.
This decades-long training effect on resting heart rate is one of the more satisfying, directly observable markers of improving cardiovascular fitness available to anyone who tracks it consistently over time — unlike many fitness metrics that require special equipment, resting heart rate can be checked with nothing more than a watch or a phone's stopwatch, first thing each morning, and a gradual downward trend over months of consistent training is a genuinely meaningful, well-supported signal of improving aerobic conditioning.
How to measure it accurately: check your pulse first thing in the morning, before getting out of bed, before checking your phone or having caffeine — any of these can measurably elevate heart rate. Count for a full 60 seconds, or count for 30 seconds and double it, at either your wrist (radial pulse) or neck (carotid pulse). Averaging 2-3 mornings gives a more stable, reliable reading than a single measurement, since resting heart rate naturally fluctuates somewhat day to day based on sleep quality, stress, and recovery status.
The Karvonen Method, Explained Term by Term
Named after Finnish physiologist Martti Karvonen, who published the underlying research in 1957, this method calculates target heart rate zones using Heart Rate Reserve (HRR) — the gap between your maximum and resting heart rates — rather than simply taking a flat percentage of maximum heart rate alone.
Worked example: continuing our 30-year-old with a max HR of 190 bpm and a resting HR of 65 bpm: HRR = 190 − 65 = 125 bpm. For a 70% intensity target: Target HR = (125 × 0.70) + 65 = 87.5 + 65 = 152.5 bpm, rounding to about 153 bpm.
It's worth comparing this to what a simple percentage-of-max-HR approach would produce for the same person, to make the practical difference concrete. A flat 70% of max HR alone would give 190 × 0.70 = 133 bpm — a full 20 beats per minute lower than the Karvonen-calculated 153 bpm target for the identical intensity level and identical individual. This gap isn't a rounding error; it's the direct mathematical consequence of the Karvonen method properly accounting for the fact that heart rate never drops to zero, even at complete rest. For someone with a higher resting heart rate (indicating lower baseline fitness), the gap between the two methods shrinks; for someone with a very low resting heart rate (indicating higher fitness), the gap grows even larger — which is exactly the kind of individual variation a purely age-based percentage approach cannot capture at all.
Why does adding resting HR back in at the end matter so much? Because your heart rate never actually drops to zero — it drops to your resting rate. A percentage calculated purely off max HR ignores this floor entirely, which is precisely why the Karvonen method is widely considered more personalized and physiologically accurate than a simple "percentage of max HR" approach, especially for individuals whose fitness level (and therefore resting HR) differs meaningfully from a population average.
The 5 Training Zones, and What Each One Is Actually For
| Zone | % of HRR | Primary Purpose |
|---|---|---|
| Zone 1 · Very Light | 50–60% | Warm-up, active recovery, cooldown |
| Zone 2 · Light | 60–70% | Base endurance, fat-burning percentage is highest here |
| Zone 3 · Moderate | 70–80% | Aerobic fitness, general cardiovascular conditioning |
| Zone 4 · Hard | 80–90% | Anaerobic threshold, lactate tolerance, race-pace training |
| Zone 5 · Maximum | 90–100% | Peak effort, VO2 max development, short high-intensity intervals |
A well-rounded training program typically spends the majority of total training time in Zones 1-2, with more limited, deliberate sessions in Zones 3-5 — a pattern often called "polarized training" in sports science, where the bulk of volume happens at easier intensities, punctuated by shorter, harder sessions, rather than constantly training at an undifferentiated "medium-hard" pace that maximizes neither endurance nor high-intensity adaptation.
This polarized approach is worth understanding a bit further, since it runs counter to a common intuition that harder training always produces better results faster. Research on elite endurance athletes across multiple sports has repeatedly found that a large majority of their total training volume — often cited in the range of 75-80% — happens at low intensity (roughly Zone 1-2), with a smaller portion of genuinely hard, high-intensity work layered on top. The physiological logic is that low-intensity volume builds the aerobic base, capillary density, and mitochondrial efficiency that high-intensity work then builds upon, while also allowing enough recovery capacity to make those harder sessions genuinely effective rather than perpetually fatigued. For recreational exercisers, the practical takeaway isn't necessarily to replicate elite training volume, but to recognize that "every session should feel hard" is not, in fact, how most successful endurance training programs are actually structured.
The "Fat-Burning Zone" Myth, Unpacked
Zone 2 is often marketed as the "fat-burning zone," and this claim is technically true but frequently misunderstood in a way that leads to poor exercise decisions. At lower intensities, the body does draw a higher percentage of its total energy from fat rather than carbohydrate. But total calorie burn per minute is considerably lower at low intensity than at high intensity — meaning higher-intensity exercise can burn more total fat calories per session, despite a lower percentage of calories coming from fat, simply because total energy expenditure is so much greater.
Practical takeaway: if your primary goal is to lose body fat, exercise intensity should be chosen based on what you can sustain consistently and what fits your overall program — not based on chasing the specific percentage-from-fat metric implied by "fat-burning zone" marketing. Both lower and higher intensity training have a genuine, evidence-based place in a well-rounded program, for different physiological reasons than the popular "fat-burning zone" framing suggests.
How Accurate Are These Formulas, Really?
It's worth being honest about the limitations layered throughout this entire calculation chain. The max HR formula carries a standard error of roughly ±10-12 bpm. Individual max HR is also influenced by genetics, training history, and even the specific type of exercise (max HR during cycling is often several beats lower than during running, for the same individual, due to differences in muscle mass engaged and body position). Resting HR, meanwhile, fluctuates with sleep, hydration, stress, and illness.
The right way to use this calculator: treat the resulting zones as a well-reasoned starting point, not an exact, immovable prescription. Many experienced athletes and coaches adjust zones over time based on how training actually feels, using tools like the "talk test" (can you hold a conversation? — roughly Zone 2 or below) or perceived exertion scales alongside heart rate numbers, rather than treating the calculated bpm ranges as absolute.
Heart Rate Monitors & Wearable Accuracy
Most people today track heart rate during exercise using a wrist-worn fitness tracker or smartwatch, using a technology called photoplethysmography (PPG) — essentially, a small light sensor shining into the skin and measuring blood flow changes to estimate pulse. Chest strap monitors, by contrast, measure the heart's actual electrical activity directly, similar in principle to a basic ECG.
| Device Type | How It Works | Typical Accuracy |
|---|---|---|
| Chest Strap | Detects electrical activity (ECG-like) | Very high — considered the field standard for accuracy |
| Wrist-Worn Optical (PPG) | Light-based blood flow sensing | Good at rest and steady-state cardio; less reliable during rapid intensity changes or activities with significant wrist movement |
A practical accuracy note: wrist-based optical sensors tend to lag behind true heart rate during rapid intensity changes (like interval training) and can be thrown off by movements such as weightlifting, boxing, or activities with a lot of wrist motion, as well as by tattoos, certain skin tones, or a loose-fitting band affecting sensor contact. For zone-based interval training where precise real-time accuracy matters most, a chest strap monitor remains the more reliable option; for general steady-state cardio, a well-fitted wrist device is usually sufficient.
A Life-Stage Guide: Students, Athletes & Older Adults
Students & Young Adults
Younger people generally have a higher predicted max HR and can typically recover faster between high-intensity efforts than older adults — school and youth sports programs often incorporate heart rate training in a general, exploratory way, and this calculator works well as an educational tool for understanding the underlying physiology alongside any structured training.
Recreational & Competitive Athletes
This is the group heart rate zone training was most directly developed for, and where the Karvonen method's personalization genuinely earns its keep — two athletes of the same age with meaningfully different resting heart rates, reflecting different current fitness levels, will get correspondingly different, more individually appropriate target zones from this method than from a simple age-based percentage.
Older Adults & Beginners
Maximum heart rate predictably declines with age, and for anyone new to structured exercise, or returning after a long break, starting consistently in the lower zones (1-2) and progressing gradually is both safer and, according to a substantial body of exercise science research, an effective long-term strategy for building a sustainable fitness base. Anyone with a diagnosed heart condition, or starting vigorous exercise for the first time after a long sedentary period, should consult a doctor before beginning a structured heart rate training program, since individual medical clearance appropriately takes precedence over any general-purpose calculator.
It's also worth knowing that certain common medications can directly affect heart rate readings in ways this calculator has no way to account for. Beta-blockers, commonly prescribed for blood pressure or certain heart conditions, specifically work by lowering both resting and maximum heart rate — someone taking this class of medication will typically see meaningfully lower numbers across the board than the population-average formulas in this calculator predict, sometimes by 20-30 bpm or more at the maximum end. Anyone on heart rate-affecting medication should discuss appropriate training zones directly with their prescribing doctor rather than relying on the standard formulas here, since the formulas were derived from populations not systematically accounting for this kind of medication effect.
How to Use the Heart Rate Zone Calculator
- Open the Target Heart Rate Zone Calculator.
- Enter your age and your resting heart rate, measured as described above.
- Choose your preferred max heart rate formula — the classic 220-minus-age or the Tanaka formula.
- Read your results instantly: maximum heart rate, heart rate reserve, and all 5 training zones with their bpm ranges and training purpose all update as you type.
- Use the Export buttons to download a PDF or Excel summary to reference during training or share with a coach.
Terminology Key
| Term | Meaning |
|---|---|
| Max HR | Maximum Heart Rate — the highest heart rate an individual can safely achieve during maximal exertion |
| Resting HR | Heart rate measured at complete rest, typically first thing in the morning |
| HRR | Heart Rate Reserve — the difference between max HR and resting HR |
| Karvonen Method | The heart-rate-reserve-based formula for calculating training zones |
| VO2 Max | The maximum rate of oxygen the body can use during intense exercise — a key marker of aerobic fitness |
| Anaerobic Threshold | The intensity at which the body shifts to predominantly anaerobic energy production, associated with rapidly rising lactate |
These terms recur throughout sports science literature, coaching resources, and the display screens of most fitness trackers and smartwatches, so understanding this vocabulary well makes reading further training resources considerably easier going forward.
Frequently Asked Questions
What is the Karvonen formula?
It calculates target heart rate zones using heart rate reserve — the gap between max and resting heart rate — rather than a flat percentage of max HR alone, producing more personalized zones.
Is the fat-burning heart rate zone a myth?
Partially. Lower intensity burns a higher percentage of calories from fat, but higher intensity burns significantly more total calories per minute, often including more total fat calories.
How accurate is the 220 minus age formula?
It carries a standard error of about ±10-12 bpm, meaning individual actual max HR can differ substantially. The Tanaka formula is generally considered somewhat more accurate across a broader age range.
What is the most accurate way to find my actual max heart rate?
A supervised maximal exercise test with medical monitoring is the most accurate method. Field tests exist but carry higher risk and aren't recommended without proper supervision.
Why does resting heart rate matter for calculating training zones?
It reflects cardiovascular fitness — a lower resting heart rate generally indicates a more efficient heart — and the Karvonen method uses it to produce zones tailored to individual fitness level.
Calculate Your Own Training Zones Now
Open the Heart Rate Zone Calculator →This article is for general educational purposes only and is not medical advice. Heart rate formulas are population averages and individual maximum heart rate can vary significantly. Always consult a doctor before beginning a new exercise program, particularly if you have a heart condition or are new to vigorous exercise. Last updated: August 2026.
💬 Questions & Reader Comments
Ask a question about heart rate training zones, or share your own experience. (Max 200 words)