What Is BMI, and What Does It Actually Measure?
Body Mass Index (BMI) is a simple ratio of your weight to the square of your height, used as a fast, population-level screening tool to flag whether someone's weight is likely to fall in a range associated with higher health risk.
Imagine you are a school student learning about ratios for the first time. BMI is just that: a ratio. Take your weight in kilograms, and divide it by your height in meters, squared (multiplied by itself). That's the whole calculation — no complicated science, no lab test, nothing invasive. A doctor, a school nurse, or you yourself with a bathroom scale and a tape measure can compute it in seconds.
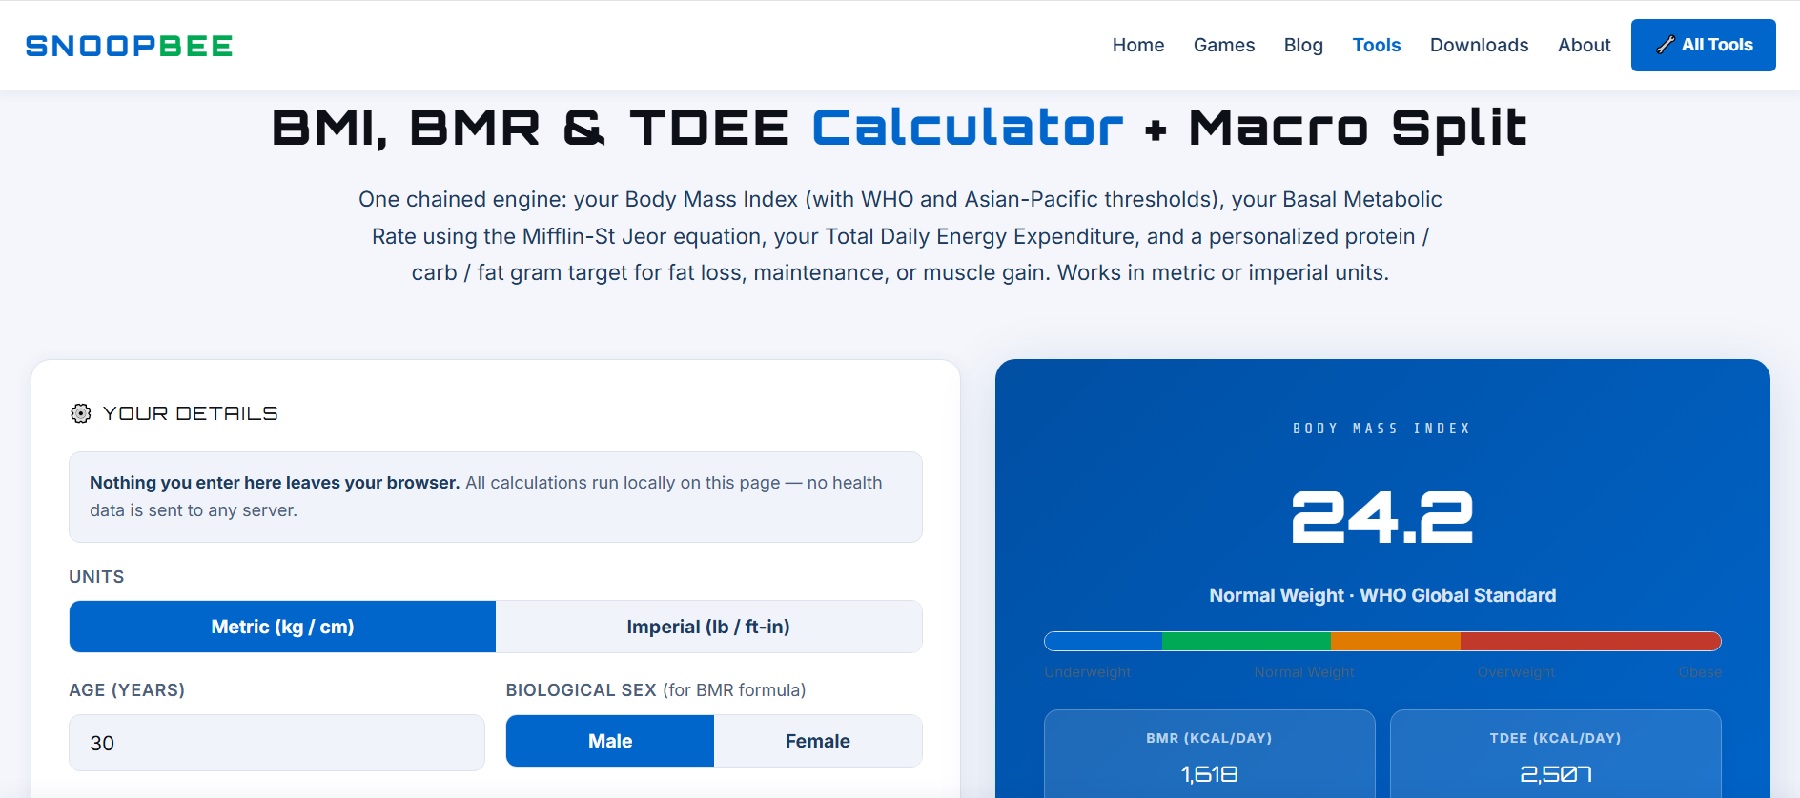
Worked example: a person who weighs 70 kg and stands 1.70 m tall has a BMI of 70 ÷ (1.70 × 1.70) = 70 ÷ 2.89 = 24.2. That single number is then compared against category boundaries (covered in the next section) to produce a label like "normal weight" or "overweight."
BMI was originally developed in the 1830s by a Belgian mathematician and astronomer named Adolphe Quetelet, who was studying the statistical distribution of human physical traits across large populations — not designing a personal health-screening tool. It was originally called the Quetelet Index, and it was only renamed "Body Mass Index" and popularized for individual clinical use in the 1970s, when a physiologist named Ancel Keys found it correlated reasonably well with body fat percentage across large population studies. That origin story matters, because it explains both why BMI is so useful (it's cheap, fast, and correlates with health risk across huge populations) and why it has real limits at the individual level (it was built and validated as a population statistic, not a personal diagnostic).
BMI Categories: WHO Global vs. Asian-Pacific Standards
Once you have a BMI number, it gets sorted into a category. The World Health Organization (WHO) publishes the most widely used global standard, but several national health authorities in Asia use different, lower cut-off points — and this calculator lets you switch between the two.
| Category | WHO Global Standard | Asian-Pacific Standard |
|---|---|---|
| Underweight | Below 18.5 | Below 18.5 |
| Normal Weight | 18.5 – 24.9 | 18.5 – 22.9 |
| Overweight | 25.0 – 29.9 | 23.0 – 24.9 |
| Obese | 30.0 and above | 25.0 and above |
Why the difference? Large population studies conducted across Japan, China, India, Singapore, and other parts of Asia have repeatedly found that health complications linked to excess body fat — including type 2 diabetes and cardiovascular disease — tend to appear at lower BMI numbers in Asian populations than in European-descent populations. Body composition differs on average between population groups even at an identical BMI: for a given BMI number, Asian populations on average carry a higher percentage of body fat and a higher proportion of visceral (abdominal) fat than European-descent populations at that same BMI. Because visceral fat surrounding internal organs is more strongly linked to metabolic disease risk than fat stored elsewhere on the body, several national health bodies — including in Japan, India, Singapore, and China — formally adopted the lower, more cautious Asian-Pacific cut-offs shown above.
Practical takeaway: if you live in, or your doctor practices under health guidelines from, Japan, China, India, Korea, Singapore, Malaysia, Thailand, the Philippines, Indonesia, Vietnam, or most of the rest of Asia, the Asian-Pacific standard is very likely the one your national guidelines actually use. If you're in North America, Europe, Australia, or New Zealand, the WHO global standard is the default. This calculator's toggle lets you check your number against whichever standard is relevant to you — or compare both side by side.
The Real Limitations of BMI
Because BMI uses only height and weight, it cannot see the single most important thing that actually determines most of BMI's associated health risks: how much of that weight is muscle versus fat, and where the fat is distributed on the body. A few concrete situations where BMI is known to mislead:
- Muscular athletes and bodybuilders often have a BMI in the "overweight" or even "obese" range despite having very low body fat percentages, because muscle tissue is denser than fat tissue and adds significant weight without adding proportional height.
- Older adults tend to lose muscle mass and gain fat mass with age even at a stable bodyweight (a process called sarcopenia), so an unchanged BMI can quietly mask a meaningfully worse body composition over the decades.
- Pregnant people should not use standard BMI categories at all — weight gain during pregnancy is expected and healthy, and pregnancy-specific weight gain guidelines exist for exactly this reason.
- Children and adolescents need age- and sex-specific growth-chart percentiles, not the adult BMI categories used in this calculator, because bodies are still developing.
- People with a naturally very short or very tall stature can see BMI behave slightly non-linearly, since the "squared height" in the formula does not perfectly scale for the extremes of the height distribution.
Bottom line: BMI is a fast screening signal, not a diagnosis. A high BMI is a prompt to look closer — at waist circumference, body fat percentage, blood pressure, and blood sugar — not a verdict on its own. If your BMI surprises you, or you fall into one of the groups above, talk to a doctor about a more complete picture rather than relying on the BMI number in isolation.
What Is BMR? The Science of Basal Metabolic Rate
Basal Metabolic Rate (BMR) is the number of calories your body burns in 24 hours doing absolutely nothing but staying alive: breathing, circulating blood, maintaining body temperature, repairing cells, and keeping your brain, liver, kidneys, and heart running.
Here's a way to picture it that works for a student who has never thought about metabolism before: imagine your body is a car engine that's turned on but parked, not driving anywhere. Even while parked, the engine idles and burns a small amount of fuel just to stay running. BMR is that idle-fuel number for your body, measured in kilocalories (what nutrition labels simply call "calories").
In a laboratory, BMR is measured using a technique called indirect calorimetry, which tracks how much oxygen a person consumes and how much carbon dioxide they produce while lying completely still, in a fasted state, in a temperature-controlled room, usually first thing in the morning. That test is precise, but it requires special equipment most people will never have access to — which is exactly why prediction equations like Mifflin-St Jeor exist: they estimate BMR closely enough for everyday use, from measurements anyone can take at home (age, sex, height, weight).
Roughly 60–75% of the total calories most people burn in a day come from BMR alone — meaning your metabolism at rest is usually the single biggest piece of your total daily energy budget, larger than exercise, larger than digestion, larger than daily movement. This is why understanding your BMR is the essential first step before any calorie or macro planning makes sense: it's the floor everything else gets built on top of.
The Mifflin-St Jeor Equation, Explained Term by Term
Several prediction equations for BMR have existed over the decades — the older Harris-Benedict equation from 1919 (later revised in 1984) was the standard for most of the 20th century. But when researchers Mifflin, St Jeor, and colleagues published a new equation in 1990, based on updated body-composition measurement technology and a more contemporary study population, it was found to predict measured BMR more accurately than Harris-Benedict for most modern adults. It has since become the equation most widely recommended by dietitian associations worldwide, and it's the formula this calculator uses.
Where W is weight in kilograms, H is height in centimeters, and A is age in years. Let's unpack why each term exists:
- 10 × Weight (kg): more body mass generally requires more energy to maintain, so weight is weighted most heavily in the formula.
- 6.25 × Height (cm): taller bodies have a larger surface area and generally more total tissue to maintain, adding a smaller but real contribution to BMR.
- −5 × Age (years): metabolic rate tends to decline gradually with age, largely because average muscle mass declines with age unless deliberately maintained through resistance training — this term subtracts a small amount for every year of age.
- +5 (men) or −161 (women): this final constant adjusts for the average difference in body composition between men and women at the same height, weight, and age — on average, men carry a higher proportion of lean muscle mass, and muscle tissue burns more calories at rest than fat tissue does. This is purely a population-average statistical adjustment, not a value judgment about any individual.
Worked example: a 30-year-old man weighing 70 kg and standing 170 cm tall: BMR = (10 × 70) + (6.25 × 170) − (5 × 30) + 5 = 700 + 1,062.5 − 150 + 5 = 1,617.5 kcal/day, rounded to about 1,618 kcal/day. That's the number of calories his body would burn in a day of complete rest.
A note on precision: like all prediction equations, Mifflin-St Jeor gives an estimate, typically accurate to within about 10% for most healthy adults — not a lab-measured exact figure. It's an excellent, well-validated starting point, and the right approach is to use it as your baseline and then adjust up or down over a few weeks based on how your actual bodyweight trends against your intake.
From BMR to TDEE: Activity Multipliers
Total Daily Energy Expenditure (TDEE) is your BMR multiplied by an activity factor that accounts for everything your body does beyond lying still: walking, working, exercising, fidgeting, and digesting food. It represents your true total calorie burn across a full day.
| Activity Level | Multiplier | Typical Description |
|---|---|---|
| Sedentary | 1.2 | Desk job, little to no structured exercise |
| Lightly Active | 1.375 | Light exercise or sports 1–3 days per week |
| Moderately Active | 1.55 | Moderate exercise or sports 3–5 days per week |
| Very Active | 1.725 | Hard exercise or sports 6–7 days per week |
| Extremely Active | 1.9 | Physically demanding job plus daily training, or twice-daily training |
Continuing the worked example above: that same 30-year-old man with a BMR of 1,618 kcal/day, who exercises moderately 3–5 days a week (multiplier 1.55), has a TDEE of 1,618 × 1.55 = 2,508 kcal/day. This is the number of calories he would need to eat to maintain his current weight — his true daily energy "budget."
Common mistake: most people overestimate their real-world activity level, especially the difference between "moderately active" and "very active." Fitness trackers and honest weekly logs consistently show that people who believe they exercise "very actively" often more closely match the "moderately active" multiplier once actual workout frequency and intensity are tallied. If your weight trend over 2–3 weeks doesn't match your calculator prediction, this is the most common reason why — try dropping one activity level before assuming the formula itself is wrong.
Setting Calorie Targets: Fat Loss, Maintenance & Muscle Gain
TDEE is your maintenance number — the calories that keep your weight stable. To lose fat, gain muscle, or maintain, you adjust your intake up or down from that baseline.
| Goal | Typical Adjustment | Why |
|---|---|---|
| Fat Loss | ~15–25% below TDEE | A moderate, sustainable deficit that preserves muscle better than an aggressive one |
| Maintenance | At TDEE (0%) | Body weight stays stable over time |
| Muscle Gain | ~10–15% above TDEE | A modest surplus supports new muscle growth while limiting excess fat gain |
The underlying physics is simple: a kilogram of body fat stores roughly 7,700 kcal of energy. A sustained daily deficit of 500 kcal, for example, works out to about 3,500 kcal over a week — roughly 0.45 kg, or about 1 lb, of fat loss per week, which is why "500 kcal below TDEE" has long been a commonly cited rule of thumb for a moderate, sustainable rate of fat loss.
Why extreme deficits backfire: very large calorie deficits (more than roughly 25–30% below TDEE) tend to accelerate muscle loss alongside fat loss, increase hunger and fatigue, and are statistically much harder to sustain for more than a few weeks. A moderate, sustainable deficit that a person can actually maintain consistently for months reliably outperforms an aggressive deficit abandoned after two weeks.
Understanding Macronutrients: Protein, Carbs & Fat
Calories tell you how much to eat. Macronutrients — protein, carbohydrates, and fat — tell you what that food should be made of. Each gram of each macronutrient carries a fixed number of calories:
| Macronutrient | Calories per Gram | Primary Role in the Body |
|---|---|---|
| Protein | 4 kcal/g | Builds and repairs muscle, organs, enzymes, and immune cells; helps preserve muscle during a calorie deficit |
| Carbohydrates | 4 kcal/g | Primary fuel source for the brain and for high-intensity exercise; replenishes muscle glycogen stores |
| Fat | 9 kcal/g | Supports hormone production, vitamin absorption (A, D, E, K), and cell membrane structure |
Notice that fat carries more than double the calories per gram of protein or carbohydrate — this is precisely why fat is described as "energy-dense," and why relatively small amounts of fatty foods can contribute a large share of total daily calories.
How to Build Your Own Macro Split, Step by Step
This calculator builds your macro split in a specific, deliberate order, because the order matters: protein and fat are set first as fixed targets, and carbohydrates absorb whatever calories remain.
- Set your protein target in grams per kilogram of bodyweight — commonly 1.6–2.2 g/kg for active adults, with the higher end of that range typically recommended during a fat-loss phase to help protect muscle mass.
- Set your fat target as a percentage of total daily calories — commonly 20–35%, since fat is essential for hormone health and should rarely be pushed lower than this range for extended periods.
- Carbohydrates fill the remainder of your calorie target after protein and fat calories are subtracted.
Worked example: continuing our 30-year-old, 70 kg man at a 2,508 kcal maintenance target, using 2.0 g/kg protein and 25% fat: Protein = 2.0 × 70 = 140 g (560 kcal). Fat = 25% × 2,508 = 627 kcal ÷ 9 = 70 g. Remaining calories for carbs = 2,508 − 560 − 627 = 1,321 kcal ÷ 4 = 330 g of carbohydrates.
Why carbs go last, not protein or fat: protein has a fairly narrow, well-evidenced optimal range tied directly to bodyweight and training status, and fat has a hard biological minimum tied to hormone health — neither should be treated as the flexible variable. Carbohydrate needs, by contrast, vary enormously based on activity level and personal preference, and the body can function across a very wide range of carbohydrate intakes, which is exactly why it's the macro left to "fill the gap."
A Life-Stage Guide: Students, Professionals & Retirees
Students & Young Adults (Teens to Early 20s)
Bodies are often still growing through the late teens, and both BMI categories and calorie targets need extra caution in this age group — a school student should treat this calculator as an educational tool for understanding the math, not as a personal diet plan, and should talk to a parent, school nurse, or doctor before deliberately restricting calories. Activity levels also tend to be naturally higher in this age group due to school sports and general higher baseline movement, which the activity-level dropdown accounts for.
Working Professionals (20s–50s)
This is the group the Mifflin-St Jeor equation and standard activity multipliers were built and validated most directly for. The most common practical mistake in this age group is under-reporting sedentary time — a desk job with a gym session three times a week is still much closer to "Lightly Active" than "Very Active" once the other 21 hours of the week are accounted for honestly.
Retirees & Older Adults (65+)
BMR naturally declines with age partly because of gradual muscle loss (sarcopenia), which the age term in the Mifflin-St Jeor formula partially accounts for — but resistance exercise at any age can meaningfully slow that muscle loss and keep real-world metabolic rate higher than the formula alone would predict. Older adults should also apply extra caution around aggressive calorie deficits, since preserving muscle mass and bone density becomes an increasingly important priority relative to fat loss alone, and should involve a doctor before making significant changes to diet.
How to Use the BMI / BMR / TDEE / Macro Calculator
- Open the BMI, BMR & TDEE Calculator and choose your unit system — metric or imperial.
- Enter your age, biological sex, height, and weight. Biological sex feeds only into the BMR formula's final constant, described above.
- Choose the WHO Global or Asian-Pacific BMI standard to match your relevant health guideline.
- Select your honest activity level from the dropdown — when in doubt, round down, not up.
- Pick a goal pill — Fat Loss, Maintain, or Muscle Gain — or manually adjust the protein-per-kg and fat-percentage fields to build a fully custom split.
- Read your results: BMI and category, BMR, TDEE, target calories, ideal weight range, weekly rate of change, and your full protein/carb/fat gram breakdown all update instantly as you type.
- Use the Export buttons to download a PDF or Excel summary to bring to a doctor, dietitian, or personal trainer.
Terminology Key
| Term | Meaning |
|---|---|
| BMI | Body Mass Index — weight divided by height squared |
| BMR | Basal Metabolic Rate — calories burned at complete rest |
| TDEE | Total Daily Energy Expenditure — BMR × activity factor |
| Mifflin-St Jeor | The 1990 BMR prediction equation used in this calculator |
| Macro | Short for macronutrient — protein, carbohydrate, or fat |
| Calorie Deficit | Eating fewer calories than your TDEE, resulting in weight loss over time |
| Calorie Surplus | Eating more calories than your TDEE, resulting in weight gain over time |
| Sarcopenia | The gradual, age-related loss of muscle mass and strength |
Frequently Asked Questions
What is a good BMI?
Under the WHO global standard, 18.5–24.9 is classified as normal weight. Under Asian-Pacific thresholds used across much of Asia, the normal range is 18.5–22.9, reflecting higher average health risk at a given BMI in Asian populations.
What is the difference between BMR and TDEE?
BMR is the energy your body burns at complete rest. TDEE is BMR multiplied by an activity factor, representing your true total daily calorie burn including movement and exercise.
Why does the Mifflin-St Jeor equation use different constants for men and women?
On average, men carry more lean muscle mass at the same height, weight, and age, and muscle burns more calories at rest than fat — the constants approximate that average physiological difference across large populations.
How much protein do I need per day?
A commonly cited range for active adults is 1.6–2.2 grams per kilogram of bodyweight per day, with the higher end often used during a fat-loss phase to help preserve muscle mass.
Is BMI accurate for athletes?
Not reliably. BMI can't distinguish muscle from fat, so very muscular individuals are often classified as overweight or obese despite low body fat — a body fat percentage measurement is more informative in these cases.
Run Your Own Numbers With the Full Calculator
Open the BMI, BMR & TDEE Calculator →This article is for general educational purposes only and is not medical advice. BMI, BMR, and TDEE formulas are population-average estimates and can be inaccurate for pregnant people, children, adolescents, very muscular athletes, and older adults. Always consult a doctor, registered dietitian, or other qualified health professional before making significant changes to your diet or exercise routine. Last updated: August 2026.
💬 Questions & Reader Comments
Ask a question about BMI, BMR, TDEE, or macro splits, or share your own experience. (Max 200 words)